


Dow, S&P 500 Price Analysis
- US Stocks opened the week on their back foot, continuing the post- FOMC theme from last week.
- While coronavirus cases continue to rise in a number of states the big push point last week appeared to be a lack of optimism from Chair Powell on prospects of a ‘V-shaped recovery.’
- Both the Dow and S&P 500 have interacted with interesting areas of support, setting the stage for what should be an interesting week on the economic calendar.
US Stocks Start Week on Back Foot
There was a possible shift in mood last week after the FOMC rate decision and that potential continues to show as we open a fresh week. While stocks had a meteoric rise from the March lows into the June highs, that theme has recently come back into question as new cases of the coronavirus continue to rise in a number of areas around the United States. While New York and New Jersey are currently in the early stages of reopening, other areas that had opened sooner are seeing numbers go higher and that creates a sense of worry that another shutdown or at least another set of protocols may be around-the-corner.
And while this is troubling, as is the social unrest that continues to show around the United States, the factor that seemed to have the greatest pull on markets last week was the lack of optimism shared from Chair Powell at Wednesday’s rate decision. This was the first set of projections offered from the Fed since December, a span which entails a number of risk events. And the FOMC is expecting to keep rates pegged towards zero for the foreseeable future. But – after the blockbuster NFP report from the week prior Chair Powell didn’t sound so positive on the topic of employment. While he did say that unemployment may have peaked, he also pointed out that many of the jobs that were lost may not be available when the economy re-opens. This pumped the brakes on the idea of a ‘V-shaped’ recovery that many have been hoping for after the historically negative impact to economic data.
In stocks, that tonality change has been fairly clear. The evening after the FOMC rate decision sellers showed up in US equity futures during the Asian session; and this followed-through in European and US sessions, as well, with the Dow losing more than 1800 points on Thursday. A portion of this was clawed back on Friday as prices bounced going into the weekend; but upon the open of a fresh week sellers were back in the driver’s seat and prices have pushed-below the 25,000 level in the Dow.
Dow Jones Daily Price Chart

Chart prepared by James Stanley; Dow Jones on Tradingview
Taking a step back on the weekly chart highlights the important nature of the current support zone, as this is confluent with the 25k psychological level and a trend-line projection taken from the 2016 and 2018 swing lows. This trendline had previously offered about a month worth of resistance from late-April into late-May, and as of this morning is helping to provide support to the index.

Dow Jones Weekly Price Chart
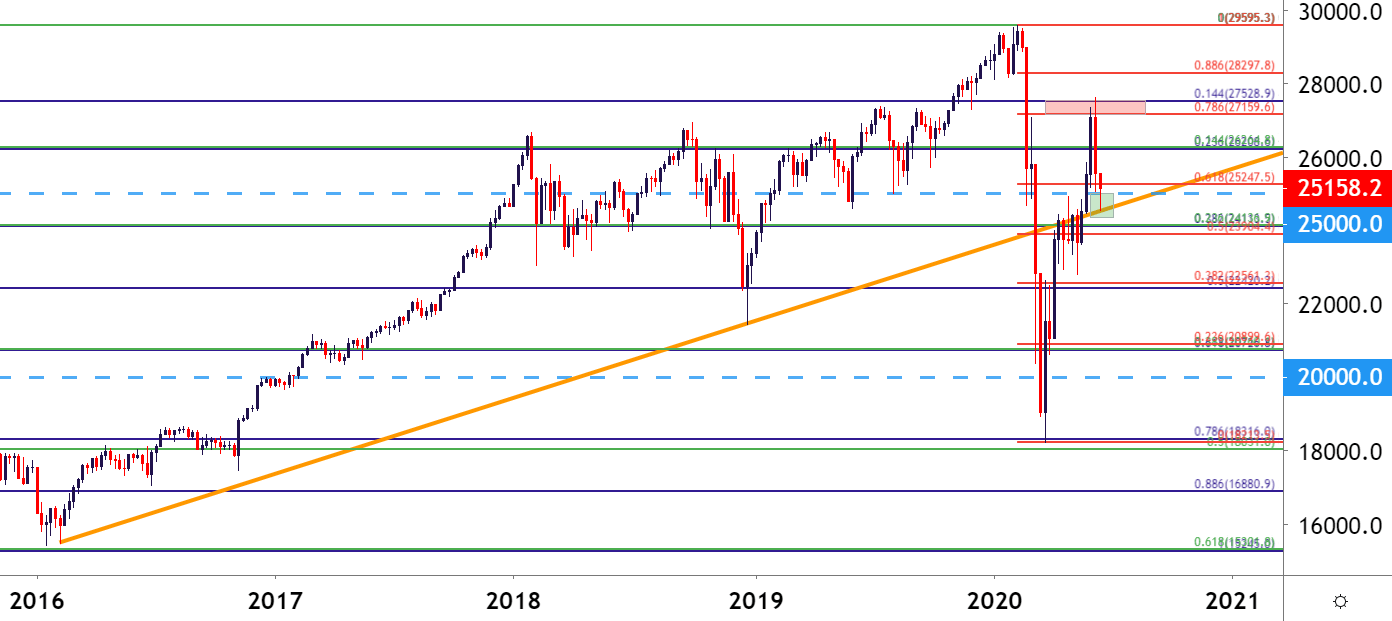
Chart prepared by James Stanley; Dow Jones on Tradingview
S&P 500 Bounces from Confluent Support
The S&P 500 is similarly reacting to a key zone of support as price action has recently begun to test the 3k psychological level with an assist from the 61.8% Fibonacci retracement of the February-March sell-off. This price of 2932 came into play overnight in S&P 500 futures as sellers slowed down and buyers showed-up, which has helped prices to bounce back-above the 3k level in the index.
Potential resistance sits around the 3022 area, which is the 23.6% marker of the 2016-2020 major move and a price that had previously helped to set a bit of support.
S&P 500 Daily Price Chart

Chart prepared by James Stanley; SPX500 on Tradingview
--- Written by James Stanley, Strategist for DailyFX.com
Contact and follow James on Twitter: @JStanleyFX


