


Nasdaq, S&P 500, Dow Jones Talking Points:
- The week started with a bang as Chair Powell gave a very publicized interview with the television program 60 Minutes.
- In that interview, Chair Powell said that there were ‘no limits’ to what the Fed can do with the lending programs available to them.
- This was met with a strong risk-on response in global markets, with the Nasdaq continuing the rally that’s shown as much as 42% from the March lows.
- Tomorrow’s economic calendar brings FOMC minutes.
Risk On Theme Continues as the Fed Pledges Continued Support
It’s not often that one can be too cranky about a 36.8% return in less than two months; but that case can currently be made around the S&P 500 considering the relativity of the matter.
Stocks got punished in February and March as fear was getting priced-in to the equation. Slowdowns were near certain as a large portion of the global economy shut down. Those shutdowns remain in effect more than two months later and this has been echoed through the economic data; such as the NFP report from earlier this month that showed a whopping 20.5 million jobs lost in the prior month. The unemployment rate spiked up to an astonishing 14.7%, and this is mere months after that same rate was grinding near 50-year-lows. But through that NFP report, stocks have continued to rally, and there’s a big reason as to why: The government.
But that 36.8% rally in the S&P 500 from the March lows pales in comparison to the 42% move put in by the Nasdaq 100 over the same period of time. Also consider the fact that the initial bearish move was considerably more-shallow, with the Nasdaq 100 selling off by 32.05% from the Feb highs to the March lows, while the S&P 500 put in a 35.9% sell-off over the same period.

That theme caught another shot-in-the-arm this week as the Sunday open was coupled with a widely-broadcast interview with FOMC Chair, Jerome Powell. I had discussed that yesterday in pertinence to Gold; and today that focus will be shifted towards US equities. In the interview, Chair Powell had what may end up being considered as his ‘whatever it takes’ moment, in which the pledge of government support continues to help shoring up markets, even with a messy and nasty fundamental backdrop.
Nasdaq 100
In a normal market turn, one might expect tech stocks to get hit a bit harder. Tech stocks traditionally trade at stronger multiples, accounting for higher potential growth rates; and in a down-turn, companies generally tighten up rather than making large capital investments in new technologies. This can create a synergistic effect on the short-side of tech around major market turns, but that simply didn’t show in February-March as evaluated between the Nasdaq and S&P 500.

As looked at last week, the Nasdaq 100 has already clawed its way back into positive territory for 2020 trade. The index set a fresh higher earlier this morning, coming just a few percentage points away from that all-time-high that was set two months ago.
Nasdaq 100 Weekly Price Chart

Chart prepared by James Stanley; Nasdaq 100 on Tradingview
On a shorter-term basis, price action is testing around some rarified air at this point. There’s been just a few weeks where price action has traded above current levels in the index, and that all took place in February before the sell-off showed. So there’s a dearth of historical samples from which to draw from. The 9500 level may provide some element of resistance as a ‘psychological level,’ and there’s a couple of prior short-term swings just above that around 9537 and 9625 before that all-time-high of 9756 comes back into view.
For traders looking at bullish strategies on US equities, the Nasdaq can remain as an attractive venue to follow.
Nasdaq 100 Four-Hour Price Chart
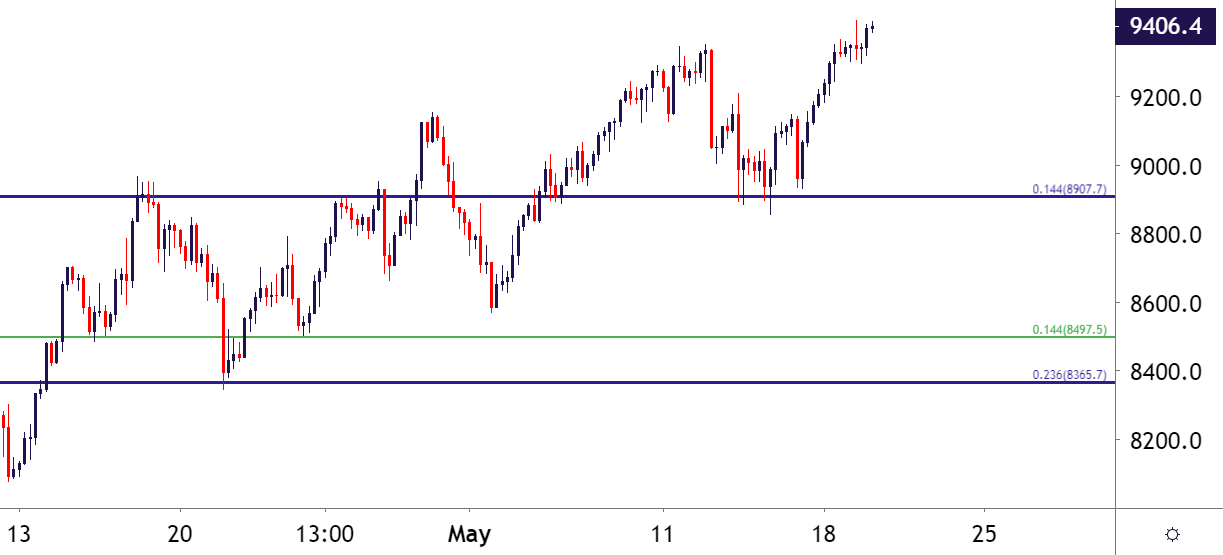
Chart prepared by James Stanley; Nasdaq 100 on Tradingview
S&P 500
The S&P 500 fell harder than the Nasdaq during the sell-off, but not as much as the Dow Jones Industrial Average. The S&P 500 had moved down by as much as 35.9% but the Dow had sold-off by a whopping 38.5% over the same period. The following bullish move was similar across the indices, with both moving up by as much as 36.8%.
There is a bit of differentiation amongst these themes, however, as the Dow put in that high in late-April, and remains subdued below the level today; while the S&P 500 put up that fresh high earlier this morning, as the bullish theme emanating from Chair Powell’s remarks has continued to get priced-in.
S&P 500 Daily Price Chart: Technically Speaking, a Fresh High This Morning

Chart prepared by James Stanley; SPX500 on Tradingview
The Dow as the Laggard
The Dow Jones Industrial Average may be a venue of interest for those looking at short-side themes in US equities. The fall was more aggressive, at 38.5%, than both the Nasdaq and S&P; and the Dow has yet to push up to a fresh monthly high while both the Nasdaq and S&P 500 have.
Comparatively, a similar trendline projection as taken from 2016 and 2018 swins, which helped to set support in the Nasdaq around the lows in March, is currently coming in as some element of resistance in the Dow, helping to hold bulls at bay even as a very pertinent theme around FOMC support has been further priced-in to risk markets.
Dow Jones Weekly Price Chart
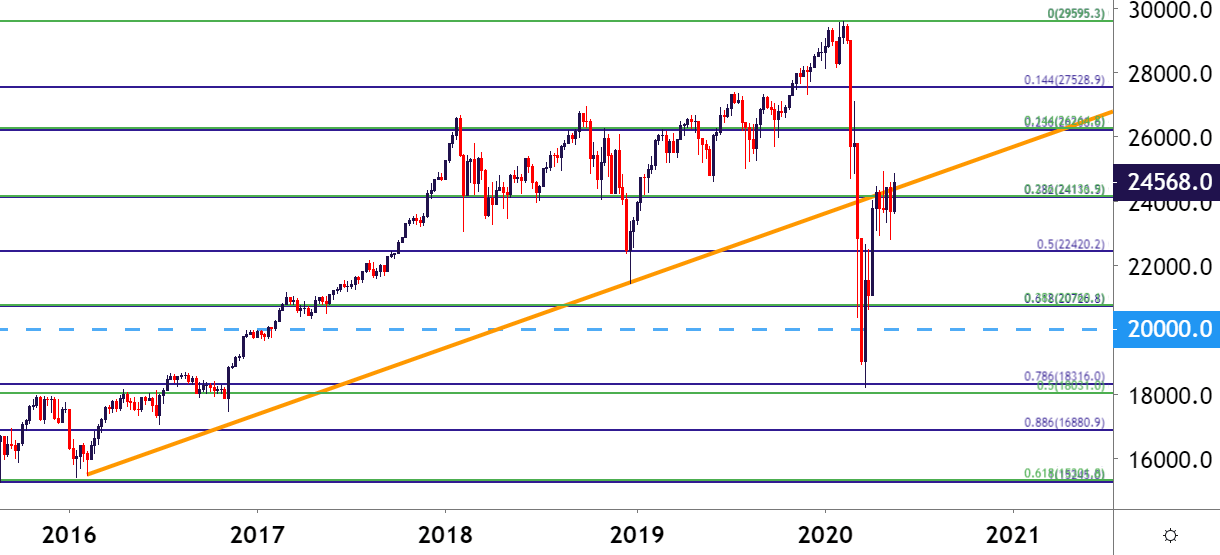
Chart prepared by James Stanley; Dow Jones on Tradingview
--- Written by James Stanley, Strategist for DailyFX.com
Contact and follow James on Twitter: @JStanleyFX


