


Gold Price Analysis
- After a rollercoaster ride that entailed a near 15% sell-off followed by a 20% rally, Gold prices have been coiling for almost a full month now.
- Gold prices have built into a symmetrical wedge with that coil, which when combined with the prior bullish trend, amounts to a bull pennant formation (looked at in the ‘Technical Analysis Chart Patterns’ portion of the recently revamped DailyFX Education Section).
Gold Prices Calm, Coil After Enthralling Two-Sided Volatility
After a quick rush of volatility in the month of March, global markets continue to calm as a cavalcade of stimulus announcements have helped to bring some support into global equities. As looked at yesterday, that support has been strong thus far as the Nasdaq 100 has run-up by as much as 41% from those March lows, going positive for the year of 2020. The S&P 500 and the Dow Jones Industrial Average are lagging those numbers; but the fact that equity markets went from a sharp bearish backdrop into a strongly bullish scenario has, at the least, allowed for a bit of calm as the world wrestles with a global pandemic.
This has had significant impact in Gold prices. As fear was picking up in March, Gold prices sold off by almost a full 15% in about a week. Support came in around a familiar area, the same zone around 1450 that helped to hold the lows during the Q4 pullback last year – and buyers made a pronounced re-entry back into the equation, helping to bid Gold prices up to fresh seven-year-highs. That took place on April 14th and, since then, price action in Gold has been largely mean-reverting with both lower-highs and higher-lows, setting up a symmetrical wedge formation atop the prior bullish trend.
Gold Four-Hour Price Chart: 14.8% Sell-Off, 20.4% Rally – Then Coil

Chart prepared by James Stanley; Gold on Tradingview
The above formation is known as a bull pennant, when a symmetrical wedge formation builds atop a prior topside trend. Such formations will generally be treated as continuation setups, looking for the prior trend to continue after digesting gains within the wedge; and these can often come into play after a fresh breakout has run into some element of resistance that causes bulls to pullback and then shy away; as trend traders look to buyer higher-lows allowing for the simultaneous build of both higher-lows and lower-highs.

Taking a step back on the chart, and there’s possible motive for resistance around recent highs. The 14.4% Fibonacci retracement comes in around 1742.50, which aligns well with that mid-April swing-high; after which buyers have been unable to break-up to a fresh higher-high even as the monetary cannons remain on full blast.
Gold Monthly Price Chart

Chart prepared by James Stanley; Gold on Tradingview
Gold Near-Term Strategy: Beware the Potential for a Trap
The above formation is fairly clear and visible; and has been for much of May trade. What’s suspicious and what should create caution for traders looking at continuation is the fact that buyers haven’t yet been able to pose a topside breakout. Given the technical formation, given the prior breakout and incorporated with the fundamental backdrop – which likely won’t be bringing any rate hikes anytime soon – there appears to be ample motivation on the long side of the matter. Yet, for almost a full month – price action has continued to coil, remaining subdued below that longer-term Fibonacci level looked at above.

This could have the possible makings of a bull trap, and may open the door for a deeper push to support before that bigger-picture, longer-term bullish trend is ready for continuation.
On the support side of Gold, there are a few notable areas of interest. The area from around 1675-1682 could be followed as a nearby zone of potential support; and below that is a confluent batch of levels spanning from around 1628.50 up to 1640 that can be followed for secondary support.
Gold Price Four-Hour Chart
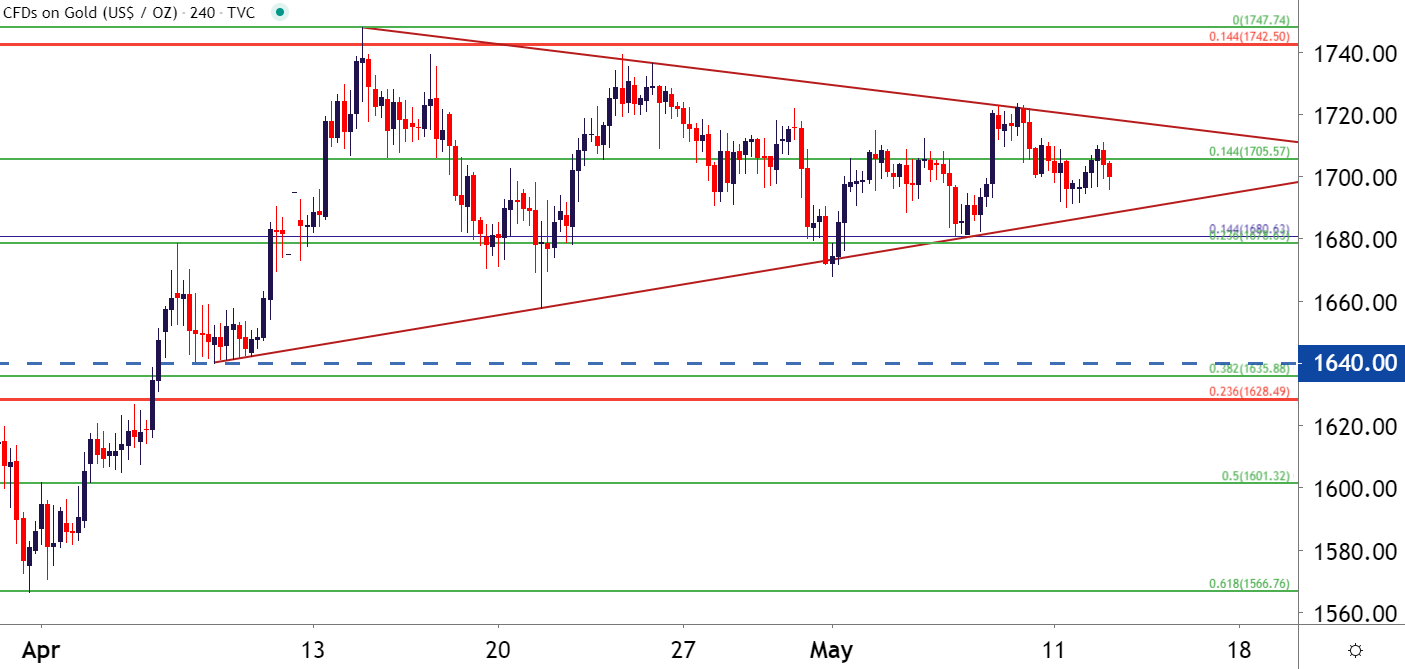
Chart prepared by James Stanley; Gold on Tradingview
--- Written by James Stanley, Strategist for DailyFX.com
Contact and follow James on Twitter: @JStanleyFX


