Australian Dollar, AUD/USD, Aussie Price Analysis
- It’s been a wild year of price action in AUD/USD and we haven’t even closed April yet.
- AUD/USD set a fresh 17-year low in May, just above the .5500 psychological level.
- Since then, far different theme has come into play and the pair is currently trading more than 800 pips away from those recent lows. The big question at this point is the conundrum of continuation and whether buyers can continue to push.
AUD/USD Sets Fresh 17-Year Low in March
The Australian Dollar has been a fast mover so far in 2020; and when combined with flows in and out of the US Dollar, this has set the stage for a fairly wild ride in the AUD/USD pair.
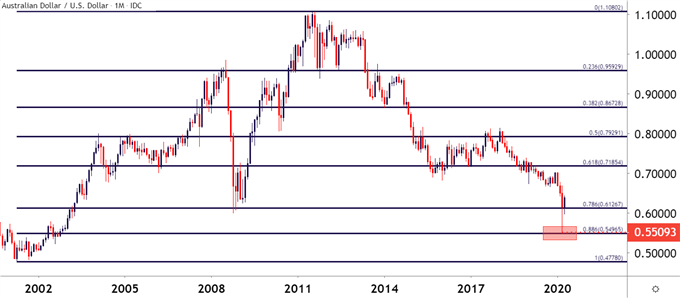
Big-picture, AUD/USD has been in varying forms of sell-off for now more than two years after topping out in January of 2018 above the .8000-handle. The fireworks showed up soon after New Year Day in 2019 as a ‘flash crash’ type of scenario showed in the pair, with a precipitous drop down to fresh nine-year lows. Support developed around the .6750 psychological level and a bit of a recovery did take place in January; but after trading above the .7000 level sellers came back in February and continued to push into Q4 trade.
Another bearish wave began in the pair around the open of 2020 trade after AUD/USD had touched up to a fresh five-month high on the final trading day of last year; showing around the level of .7032. That bearish theme continued through February as AUD/USD pushed down to a fresh ten-year-low; but it was the month of March when matters really began to go sideways. As a strong rush of USD-strength enveloped FX markets, AUD/USD jumped down to a fresh 17-year low, finding a bit of support just above the .5500 level, a price that hadn’t been traded at since the year 2002. This shows very near the 88.6% Fibonacci retracement of the 2001-2011 major move in the pair.
AUD/USD Monthly Price Chart

Chart prepared by James Stanley; AUDUSD on Tradingview
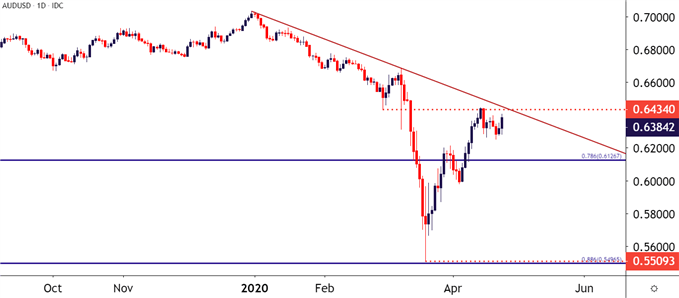
Taking a shorter-term look at the matter, and a clear change-of-pace began to show in the pair’s price action in the second half of March, and looking at the degree of the bounce thus far, it does look as though some element of capitulation took place as the pair shredded down to those fresh 17-year lows. The big question at this point is one of continuation potential and whether buyers can continue to press as AUD/USD is currently up more than 800 pips from those March lows.


AUD/USD Daily Price Chart

Chart prepared by James Stanley; AUDUSD on Tradingview
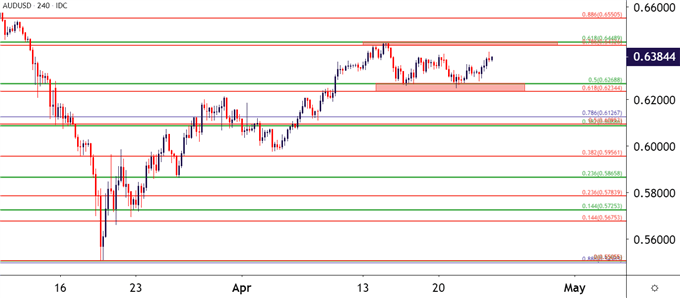
Getting even closer on the chart to look at that conundrum of continuation, and a series of levels show that may help traders to guide their strategies in either direction. There appear to be two recent major moves that offer Fibonacci levels of relevance: The 2020 sell-off and the shorter-term March major move, each of which have been applied on the below chart (in green and red, respectively).
The current monthly high showed-up in one of these confluent areas, as both the 61.8% retracement of the 2020 major move and the 78.6% retracement of the March move plot within 17 pips of each other. Similarly, recent support showed around another confluent area, taking place in the expanse between the 50% marker of the 2020 move and the 61.8% marker of the March sell-off.
| Change in | Longs | Shorts | OI |
| Daily | -4% | -10% | -6% |
| Weekly | -1% | 25% | 3% |
Sitting overhead, and also of critical importance for near-term strategies, is the .6500 psychological level. So buyers may have their work cut out for them given that there’s all of a confluent zone of Fibonacci levels, a recently set monthly high and a major psychological level sitting overhead. But, with that said, support has thus far held up so a contentious battle may soon be in the cards.
AUD/USD Four-Hour Price Chart

Chart prepared by James Stanley; AUDUSD on Tradingview
--- Written by James Stanley, Strategist for DailyFX.com
Contact and follow James on Twitter: @JStanleyFX


