


Dow, S&P 500, US Dollar Talking Points
- A bit of calm has shown this week as the risk-on trade has shown for more than a day.
- While the S&P 500 is up more than 18% from this week’s lows – we’re still more than 23% away from the highs that were set just last month.
- Going along with this revivial of strength in US equities is a bearish move in the US Dollar, hastening after this morning’s comments from FOMC Chair Jerome Powell and Treasury Secretary, Steven Mnuchin.
Stock Rally Continues
A bit of hope is holding on as the risk trade has come back to life this week. Despite another nasty open to the week the S&P 500 has held on to Tuesday’s gains and even added some more on Wednesday and, so far in Thursday trade. This happens even as US jobless claims printed in a shocking manner, with 3.2 million printing against the prior week’s 281k.
But – as with everything else in financial markets, context is important; and this shockingly negative print was at least somewhat offset when Treasury Secretary Steven Mnuchin noted that it wasn’t relevant given everything else that the Fed and now Congress have done in the effort of addressing the ongoing issues from a coronavirus-fueled slowdown.
So, at this point, given that there’s been a few days’ worth of gains strung together – the big question is whether the low has yet been put in or whether we’re at a temporary impasse in a longer-term or bigger picture sell-off. And there’s really motive on either side of the scenario: From the angle of fear, we likely haven’t yet seen the worst from the novel coronavirus and many estimates are suggesting that the ‘peak’ is at least weeks away. On the other, both the Fed and Congress have come together with economic stimulus the likes of which the world has never seen.
What can be appropriate for the trader or investor at this point is to identify areas of strength or promise for either scenario. As looked at in Tuesday and again in today’s webinar, the Nasdaq 100 has held up respectably, all factors considered. My colleague, Peter Hanks, discussed this a little earlier today. The Dow, meanwhile, has been hit especially hard as a major constituent of the index (Boeing) is battling multiple negative drivers.
At this point, the Dow has started to test resistance at an interesting spot on the chart. The price of 22,420 is the 50% marker from the 2016-2020 major move; and this is from the same Fibonacci study from which the 78.6% retracement helped to set the low after another brutal Sunday open this week.
Dow Jones Industrial Average Two-Hour Price Chart

Chart prepared by James Stanley; Dow Jones on Tradingview
S&P 500 Jumps As Much as 18% From the Lows
It’s been a big week in the S&P 500 with prices up more than 18% from this week’s lows; which is, in and of itself, an astounding amount. But – this still isn’t even 38.2% of that prior sell-off, meaning there may be more room left to run, especially if the risk-on trade takes over again after the arsenal of stimulus that’s been launched.

A similar bullish short-term structure has shown in the S&P 500, with a bit of governance produced by the same 2016-2020 major move. The 76.4% retracement helped to mark the low, the 61.8% retracement came in as support yesterday; and the 50% marker sits just ahead as the next potential spot of resistance, showing around the 2600 level.
S&P 500 Four-Hour Price Chart
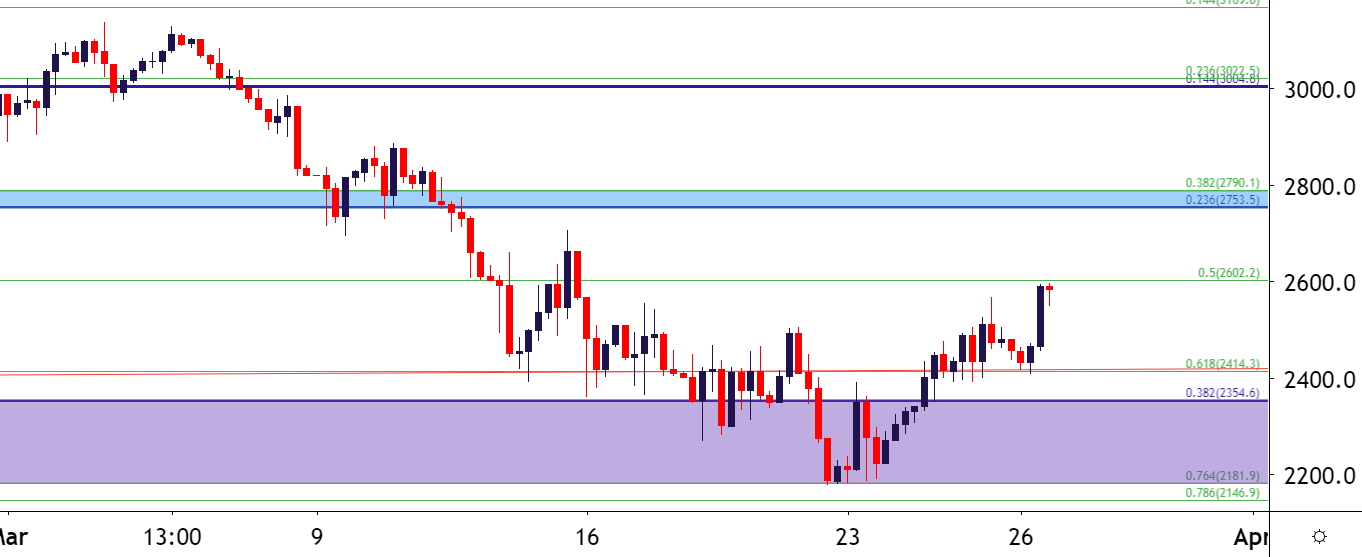
Chart prepared by James Stanley; SPX500 on Tradingview
US Dollar Snaps Back as Fed, Treasury Address Risk Aversion Head-On
In a related move, the US Dollar has put in a large pullback, going along with the revivial of strength in US equities. In a move likely related to brute-force risk aversion in mid-March, the Greenback gained as much as 8.8%, non-levered, as investors rushed for the safety of the USD.
As looked at yesterday, a mild pullback had shown in the early-portion of this week. That pullback turned deeper with aggression today as both Jerome Powell and Steven Mnuchin shared some supportive commentary earlier this morning. Powell said that the Fed’s funding is limited by what the Treasury would allow and, the Treasury, run by Steven Mnuchin, have shown no signs of yet letting up in the effort of stemming this sell-off head-on.
This was ample motive for a deeper reversal and the US Dollar has been spiraling lower ever since. For the past four hours, as of this writing, the US Dollar has begun to dig-in at a key longer-term support level. The price of 99.34 is the 14.4% Fibonacci retracement of the 2011-2017 major move.
US Dollar Monthly Price Chart

Chart prepared by James Stanley; USD on Tradingview
On a shorter-term basis, prices were catching support at the 23.6% retracement yesterday; but that has since been taken out and USD price action has even cut below the 38.2% marker of the recent bullish move. This leaves the 50% marker lurking underneath current price action as that next spot of potential support, plotted around the 98.86 level.
US Dollar Four-Hour Price Chart
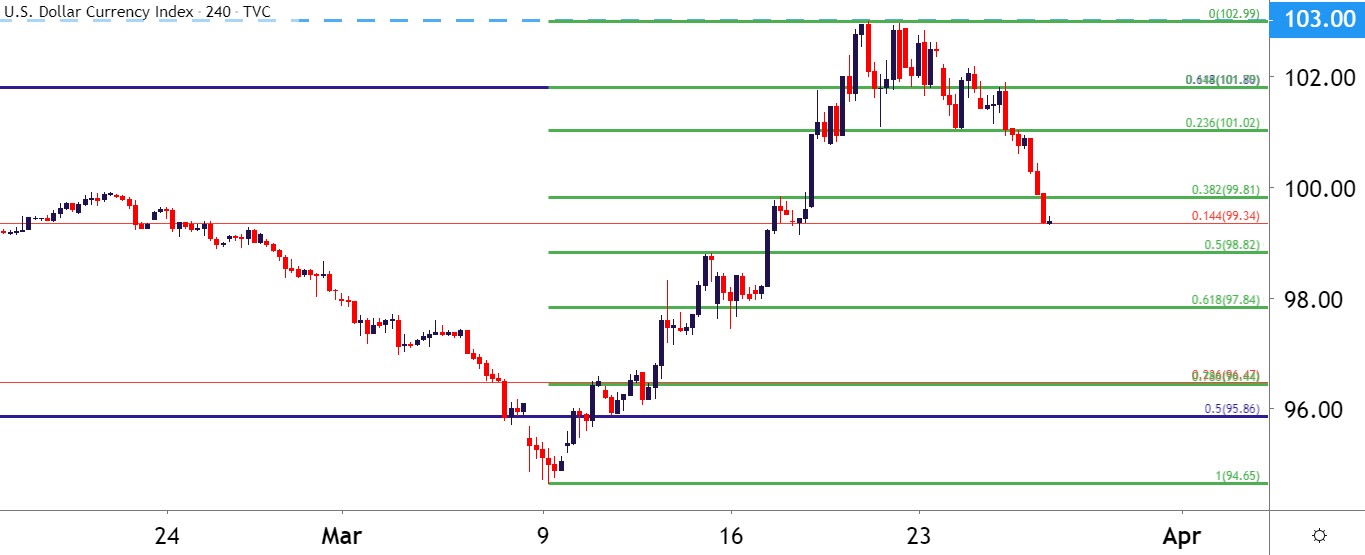
Chart prepared by James Stanley; USD on Tradingview
--- Written by James Stanley, Strategist for DailyFX.com
Contact and follow James on Twitter: @JStanleyFX


