Dow, S&P Talking Points:
- The Federal Reserve announced another emergency rate cut this weekend, going along with $700 Billion in QE for Treasuries and Mortgage-Backed Securities.
- Panic continues to permeate global markets as the novel coronavirus continues to spread.
- Both the Dow and S&P 500 found support at long-term support areas last week; and this week’s open saw the Friday pop eviscerated as price action ran right back down to these key areas on the chart.
Fed Makes Another Emergency Move – Stocks Appear Unimpressed
It was another brutal weekend of headlines as the novel coronavirus continues to spread through the United States, and this did not catch the Federal Reserve flat-footed as they announced around last night’s open that more emergency measures would be taken. And they didn’t appear to be shy about launching a trove of measures, as 100 basis points of rate cuts were announced to go along with $700 billion of QE, with $500 billion worth of treasuries to go along with $200 billion in mortgage backed securities. The Fed also cut the reserve requirement to 0%, effective March 26th. Our own Justin McQueen discussed these measures in greater depth in the article entitled, US Dollar, Gold Price, S&P 500 Outlook: Impact of Emergency Fed Rate Cuts.
Now after US equity markets opening for the day, it’s become clear that this trove of action has yet to arrest the fear and panic that’s enveloped global markets. US equity futures quickly went limit down after last night’s open, even with the support from the above-announced stimulus measures.
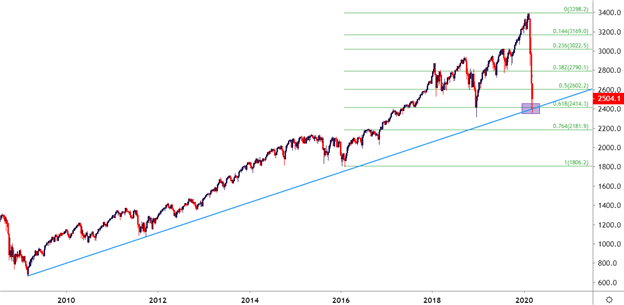
In the S&P 500, prices are re-testing a key zone of chart support after pushing down to a fresh yearly-low shortly after the 9:30 AM ET open. This support comes from a few different places, offer an element of confluence as both a trendline projection and a Fibonacci retracement are within close vicinity of each other.
The big question now with all of this stimulus announced – can buyers hold the lows at this long-term level of support? Or will this support be looked at as a mere speedbump as prices put in larger falls.
S&P 500 Weekly Price Chart

Dow Jones Re-Tests Key Support
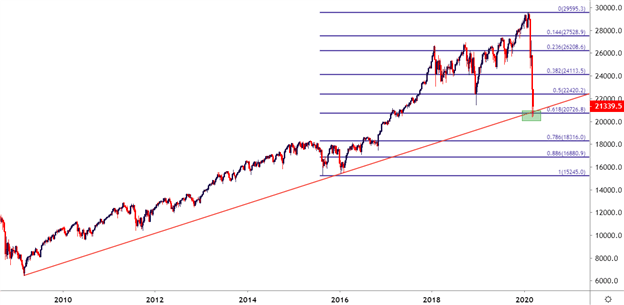
A similar backdrop is showing in the Dow with an element of confluence helping to hold current support. This comes in around the 61.8% retracement of the 2015-2020 major move, which aligns with a trendline projection as drawn from 2009 and 2016 swing lows.


Dow Jones Weekly Price Chart

--- Written by James Stanley, Strategist for DailyFX.com
Contact and follow James on Twitter: @JStanleyFX


