


US Dollar, EUR/USD, USD/CAD Price Action Talking Points
- USD – has pulled back from fresh three-year-highs set last week.
- EUR/USD threatening a deeper reversal as an ascending triangle has built, short-term.
- USD/CAD buyers back to the table – USD/CAD price action testing key resistance.
US Dollar Pulls Back After Fresh Three-Year-Highs
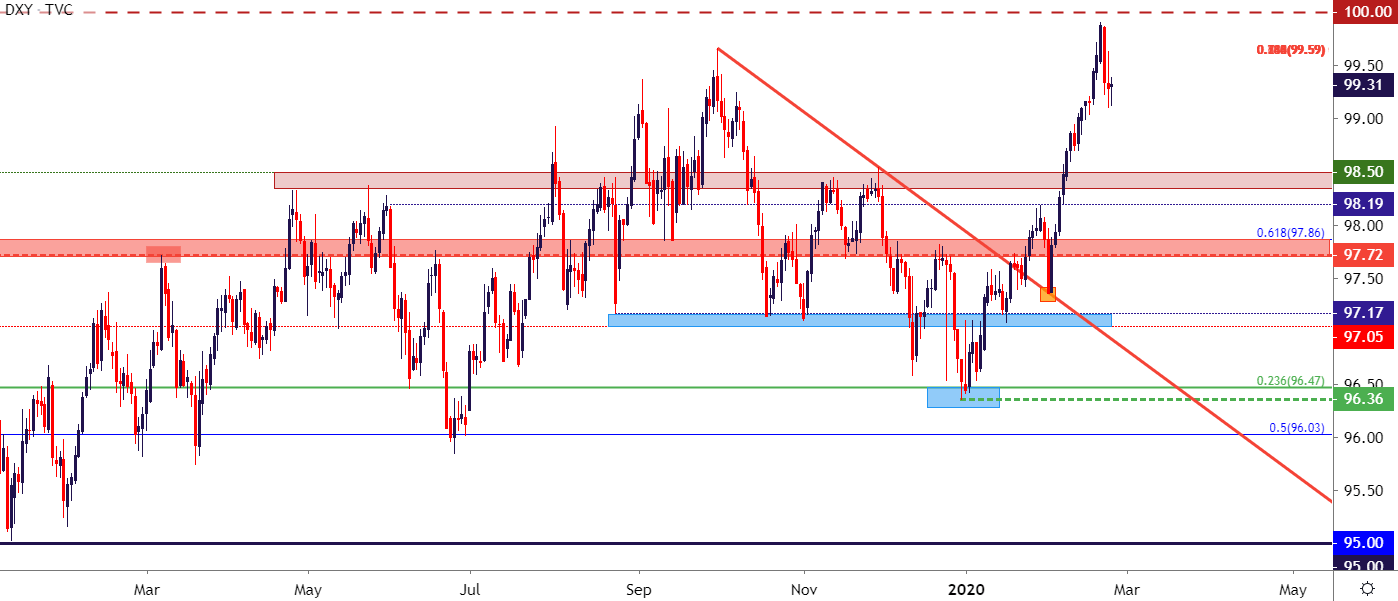
It’s been a busy year so far in the US Dollar: After the currency put in a pronounced bearish reversal in Q4 of last year, the USD came into 2020 trade grasping for support at a key Fibonacci level. After the first few days of the New Year brought in a series of higher-lows, an ascending triangle had built, opening the door for bullish breakout potential in the USD.
That further priced-through for the next few weeks, with the US Dollar catching a downdraft around the January FOMC rate decision. At that meeting, the Fed didn’t really tip their hand towards any future rate moves, instead trying to remain flexible while communicating a tone of stability. But that only lasted into the end of that week as the Greenback was ready to go into launch mode after the February open, and that theme ran very loudly for the first few weeks of the month as the US Dollar jumped up to a fresh three-year-high, erasing the entirety of the Q4 sell-off and making a fast approach towards the 100.00 level in DXY.
Friday brought a pullback and yesterday a show of support. That support has held through the Thursday opens in Asia and Europe, and ahead of the US equity open, support continues to contain the lows.
US Dollar Daily Price Chart
EUR/USD Digs into Support at 2017 Gap
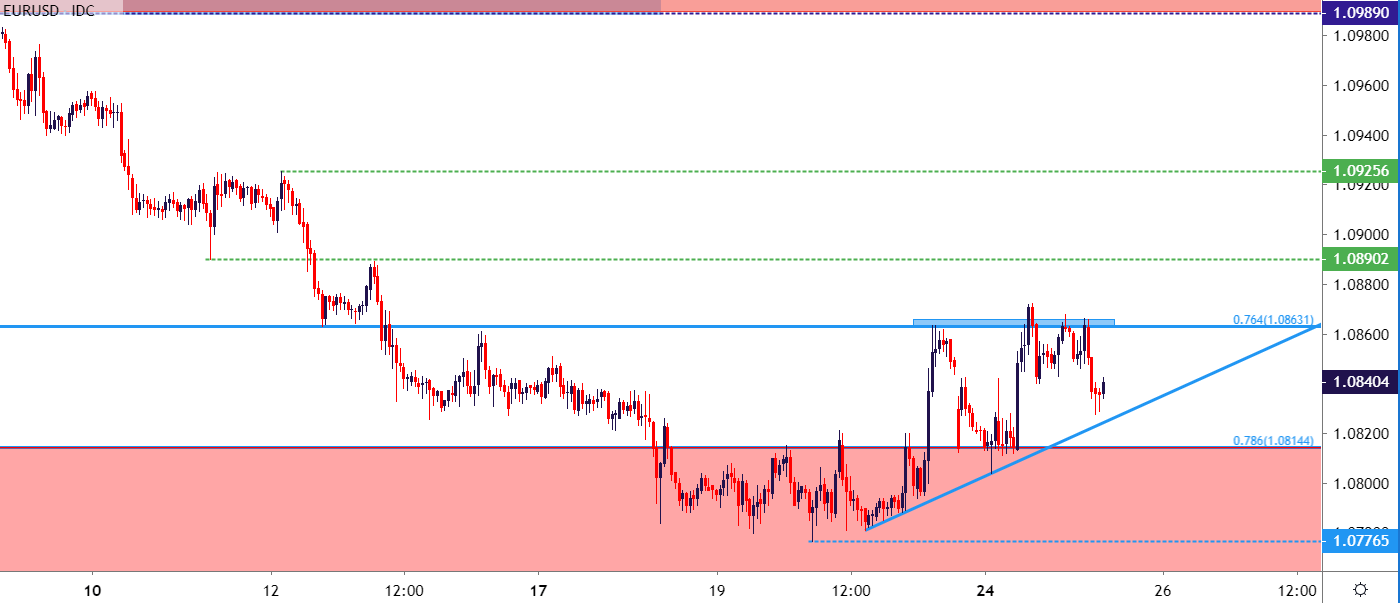
Probably one of the loudest markets for that recent rush of US Dollar strength has been the Euro, where EUR/USD pushed down to a fresh two-year-low. The pair began to fill a gap that’s been lurking on the charts since April of 2017, around the weekend of French elections. At that event, EUR/USD closed one week at 1.0725 and then quickly gapped-higher as the next week opened; with only a portion of that gap getting filled, down to the approximate 1.0820. This left approximately 95 pips of unfilled gap on the chart that, at this point, remains an item of interest on the short-side of the pair.
At this point, the current two-year-low in EUR/USD sits at 1.0777: sellers had multiple opportunities to push-lower last week but have since failed; and price action has built in a series of higher-lows along with a horizontal level of resistance. This presents a short-term ascending triangle which, similar to the US Dollar at the beginning of the year, could open the door to a deeper reversal. Sitting ahead on EUR/USD charts are potential resistance areas around 1.0890 and 1.0925. After that, a big zone of prior support that hasn’t yet been tested for resistance comes into play around the psychological 1.1000 level.
EUR/USD Hourly Price Chart
USD/CAD Gaps Up, Jumps to Resistance
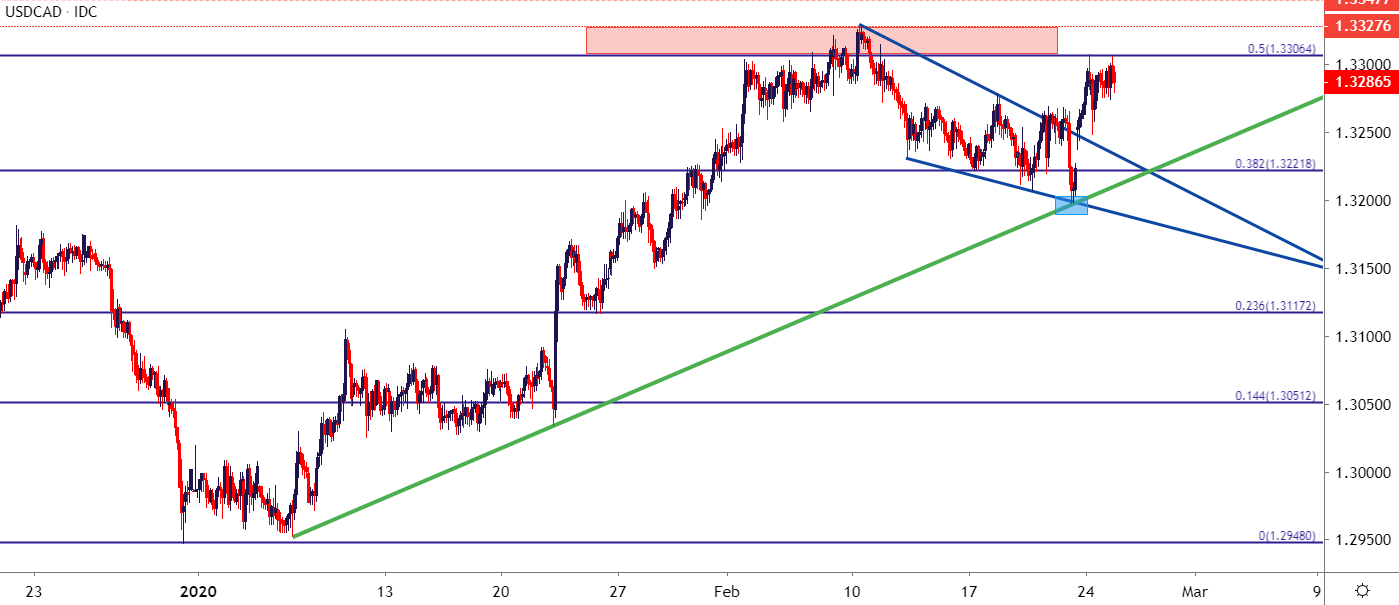
As looked at last week in the Thursday webinar, one of the areas that could be accommodative for continued USD-strength was/is USD/CAD. The pair put in an especially strong first six weeks of the New Year as a bit of CAD-weakness joined with USD-strength to amount for a strong topside breakout. But price action stretched into a sticky zone of resistance in mid-February and spent much of the week-and-a-half after in a pullback.
But, as looked at last week in the USD/CAD technical analysis article, the pair had pulled back in an orderly fashion, building a falling wedge with support showing around a key Fibonacci level. After gapping-higher to start this week, USD/CAD has once again found resistance around the 1.3308 level. For those looking at long-USD strategies, USD/CAD remains a market of interest.
USD/CAD Two-Hour Price Chart
--- Written by James Stanley, Strategist for DailyFX.com
Contact and follow James on Twitter: @JStanleyFX


