


Euro (EUR) Price, Chart and Analysis
- Euro price action has been quiet with EUR/USD range-bound of recent.
- Tomorrow brings the ECB rate decision, Christine Lagarde’s second atop the bank.
Euro Calm Reaches Historic Levels – May Not Last for Long
The lack of volatility in EUR/USD is reaching historic levels after a quiet Q4 outlay saw the pair build into a range, and that came after the first three quarters of last year showed limited movement compared to what the pair has usually done. The Average True Range indicator is currently showing a read of 113.5 pips on the weekly chart – a far cry from the 325 pips that showed in the summer of 2015 or even the 177 pips that showed around last year’s open. A combination of similarly loose monetary policy at the Fed and the ECB, combined with some receding of worry around European politics has allowed for the pair to spend most of the past three months inside of a 375-pip range.
EUR/USD Weekly Price Chart
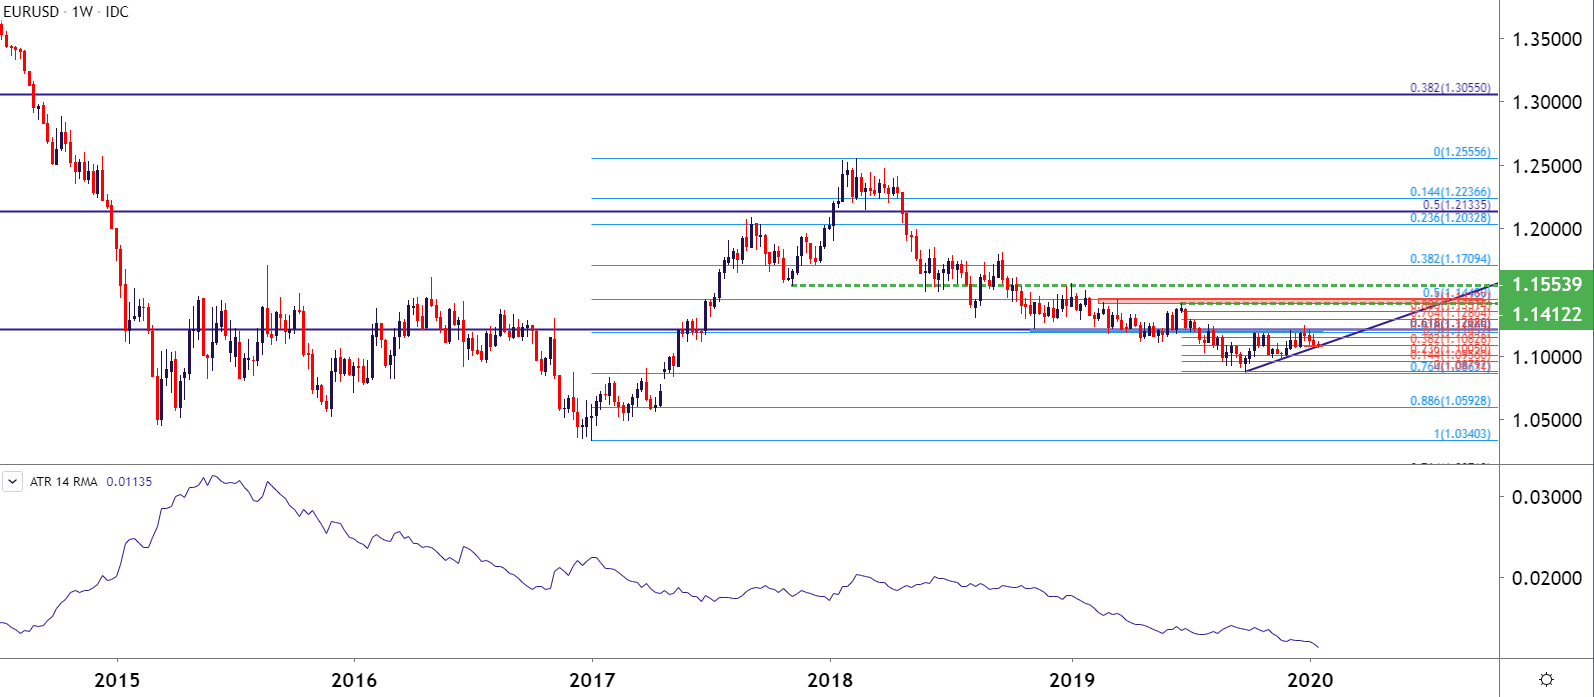
Chart prepared by James Stanley; EURUSD on Tradingview
EUR/USD Range in Focus Ahead of ECB
Since August of last year EUR/USD price action has been confined to a 375-pip range; with resistance coming in at a confluent zone of Fibonacci levels while support has been a bit more variable. The 1.1000 level has had a penchant to bring buyers into the mix, although the early-Q4 ramp of USD-strength saw the price dip inside of the 1.0900-handle, albeit temporarily.
More recently, support has come-in around another key area on the chart, and this is at 1.1082, which is the 38.2% Fibonacci retracement of last year’s June-October sell-off. This level showed resistance in late-November followed by support in late-December; and for the past three trading days helped to bring buyers back into the pair.
This sets up for a fairly interesting backdrop ahead of tomorrow’s European Central Bank rate decision.
EUR/USD Daily Price Chart
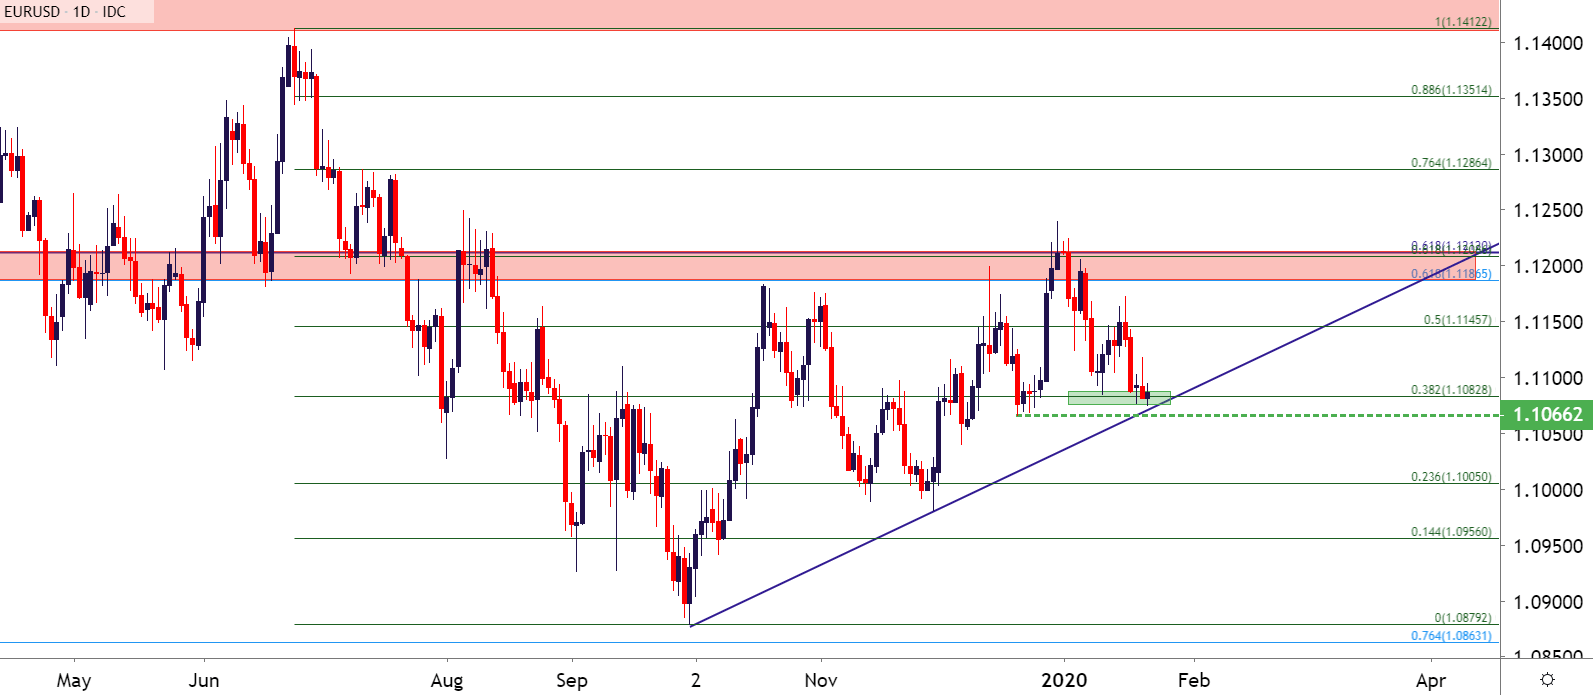
Chart prepared by James Stanley; EURUSD on Tradingview
--- Written by James Stanley, Strategist for DailyFX.com
Contact and follow James on Twitter: @JStanleyFX


