


Canadian Dollar Talking Points:
- CAD has been on a rollercoaster over the past week as last Wednesday’s BoC brought strength into the currency that was largely priced-out after Canadian employment numbers were released last Friday.
- USD/CAD had shot-up to test resistance in a prior zone of support after the Friday employment releases, and sellers have since come back to re-test monthly lows following yesterday’s FOMC rate decision. Longer-term price action continues to compress.
USD/CAD Reacts at Resistance
Last week was full of Canadian drivers helping to keep USD/CAD on the move. The Wednesday BoC rate decision saw a surge of CAD-strength as the bank side-stepped the topic of rate cuts. And then on Friday, a disappointing set of Canadian employment numbers brought back an element of CAD-weakness, allowing for USD/CAD to push-up for a re-test of resistance in a key zone on the chart, plotted from 1.3250-1.3270. This same zone had previously come-in as short-term support but this area held the highs through last week’s close and into this week’s open as global markets stared down a rather brisk economic calendar featuring the Fed and ECB.
USD/CAD Two-Hour Price Chart
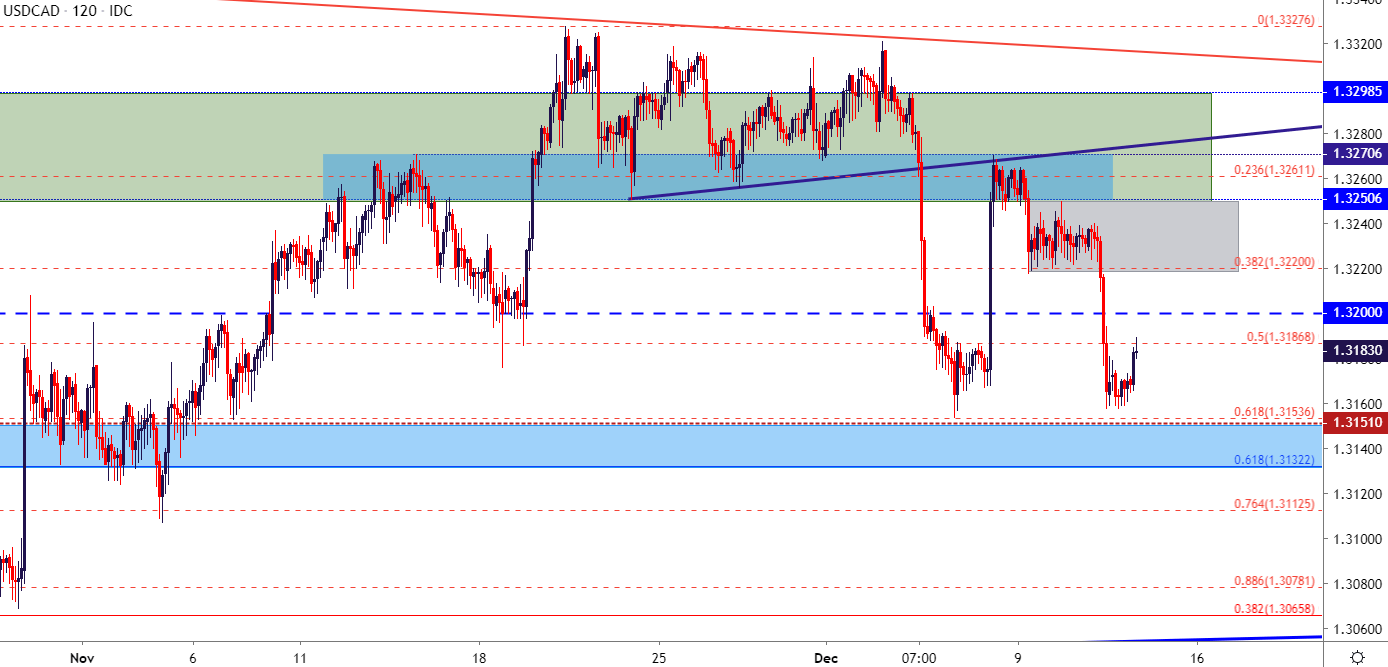
Chart prepared by James Stanley; USDCAD on Tradingview
Taking a step back on the chart and USD/CAD has been seeing a compression in price action through the second-half of this year. Support has held just above the 1.3000 handle after tests in July and then again in late-October, while resistance has been a bit more defined by a series of lower-highs that’s continued to post, most recently in early-December when a short-term bullish theme found sellers around 1.3325.
USD/CAD Daily Price Chart: 2H 2019 Compression
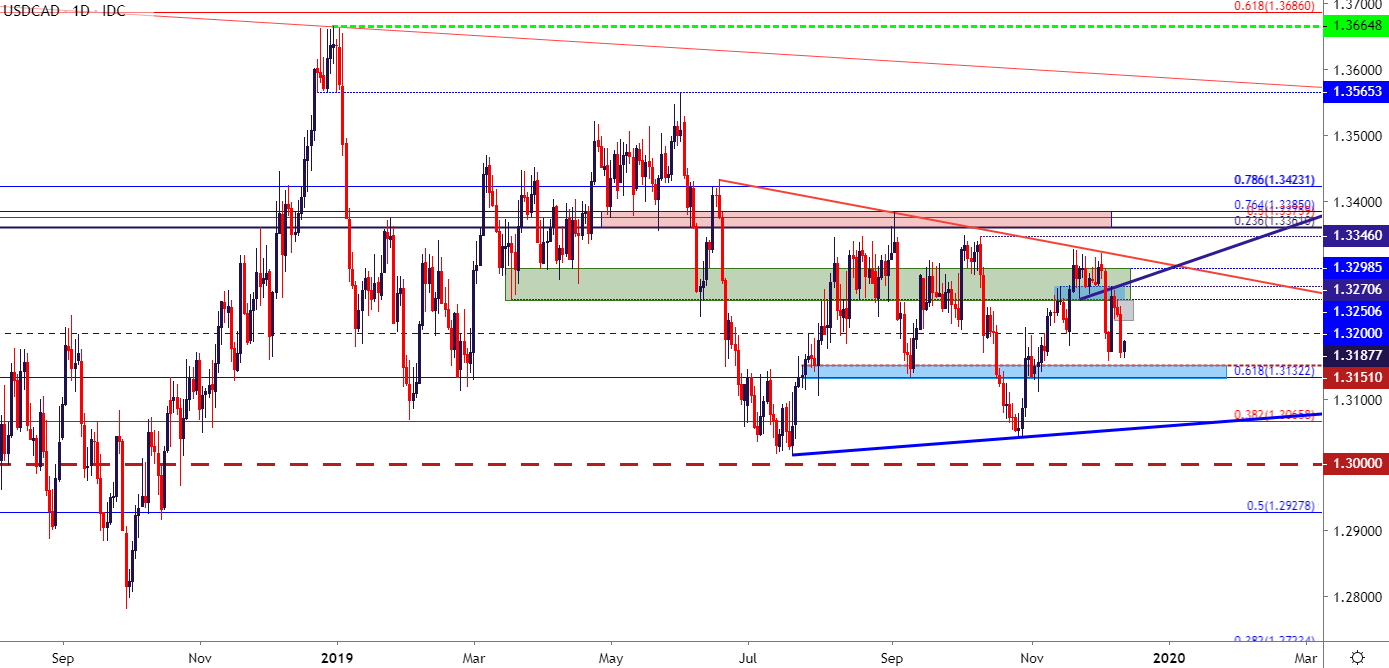
Chart prepared by James Stanley; USDCAD on Tradingview
USD/CAD Strategy
Given that we’re approximately at the half-way point of that recent bullish move while also holding very near prior December lows, and this could be a difficult point to look at establishing fresh exposure, on either side of the pair.
What could possibly change that scenario would be a quick retracement up to a prior area of short-term support, which is confluent with the 38.2% retracement of that recent topside move. This comes in around 1.3220, and if price action begins to find sellers here, the door could soon re-open for USD/CAD bears, targeting a re-test of the 1.3150 area on the chart; after which target potential exists in areas such as 1.3115 or perhaps even for a re-test of October swing lows around 1.3050.

USD/CAD Four-Hour Price Chart
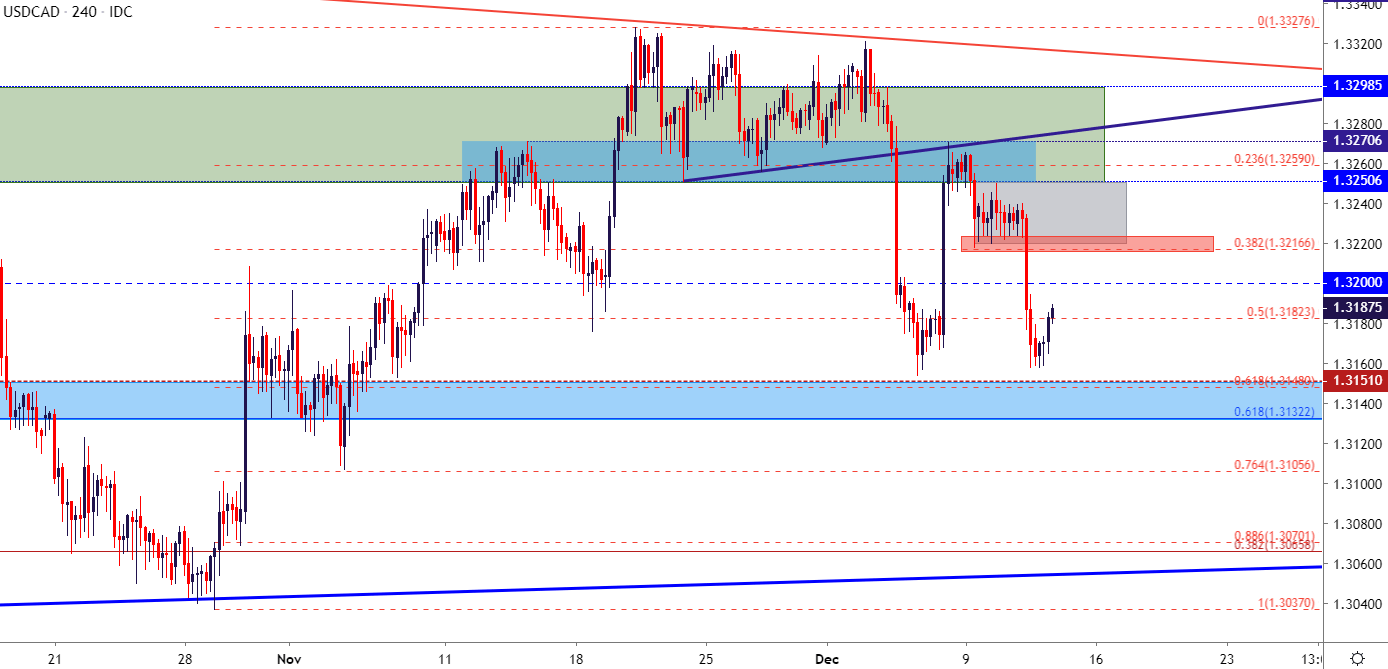
Chart prepared by James Stanley; USDCAD on Tradingview
--- Written by James Stanley, Strategist for DailyFX.com
Contact and follow James on Twitter: @JStanleyFX


