


US Dollar Talking Points:
- Last week brought some key US drives into the mix with highlights of FOMC and NFP. The net result was USD-weakness as the currency remains near two-month-lows.
- This week’s economic calendar has two high-impact USD events on the radar, and there are rate decisions out of Australia (later tonight) and the UK (Super Thursday).
- DailyFX Forecasts are published on a variety of markets such as Gold, the US Dollar or the Euro and are available from the DailyFX Trading Guides page. If you’re looking to improve your trading approach, check out Traits of Successful Traders. And if you’re looking for an introductory primer to the Forex market, check out our New to FX Guide.
US Dollar Grasps on to Support
The US Dollar has started this week with a support bounce from the October lows showing around 97.14. This comes on the heels of a really big week for the Greenback as both FOMC and NFP brought some volatility into the mix, and this week’s economic calendar is quieter around USD with only a couple of high-impact releases set for this week. Tomorrow at 10AM ET brings services ISM and Friday brings U of Mich. Consumer Sentiment. Elsewhere on the calendar rate decisions out of Australia (later tonight) and the UK (Thursday) will likely garner considerable attention as both the Aussie and the Pound have been in workable trends of recent.
In the US Dollar, the big question is whether this support holds. The FOMC rate decision last week was widely-inferred to have eliminated the prospect of near-term rate hikes as Jerome Powell said that tightening wouldn’t be in order unless inflation showed a ‘really significant’ increase. This means that FX traders will likely be focusing on data to get those next cues on USD trends.
At this stage, both support and resistance in USD price action is fairly well-defined. Resistance held last week in a zone that previously helped to hold the late-October swing-highs. This comes in around confluent Fibonacci levels at 97.96-97.94. Support has held around the two-month-low that was set a couple of weeks ago at the price mentioned previously of 97.14.
US Dollar Two-Hour Price Chart
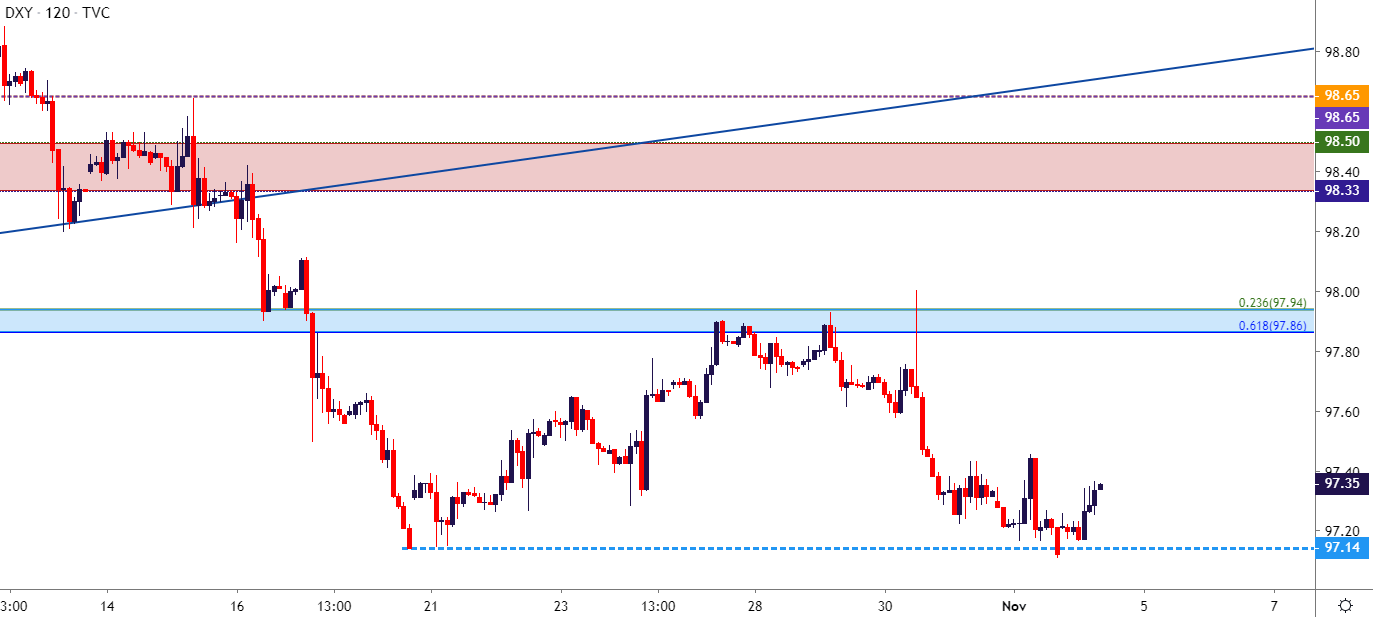
Chart prepared by James Stanley; US Dollar on Tradingview
EUR/USD Builds Range Near Resistance
EUR/USD has continued to show strength as US Dollar weakness remains a key Q4 theme. But just overhead is a big zone of potential resistance that, at this point, buyers seem hesitant to test. This has allowed for the build of a range in the pair very near two-month-highs.
For traders that do want to short the Euro or get long the US Dollar, the potential for short-side swings remain with stops lodged above either range resistance or the 1.1187-1.1212 zone. Alternatively, for Euro bulls or those looking for breakdowns in the US Dollar, the range could be approached with a prior trend-side bias; meaning looking for longs around support, scaling out on the way back to range resistance coupled with break-even stops, and then breakout logic on the remainder of the position, looking for price action to budge into that key zone of resistance.
EUR/USD Two-Hour Price Chart
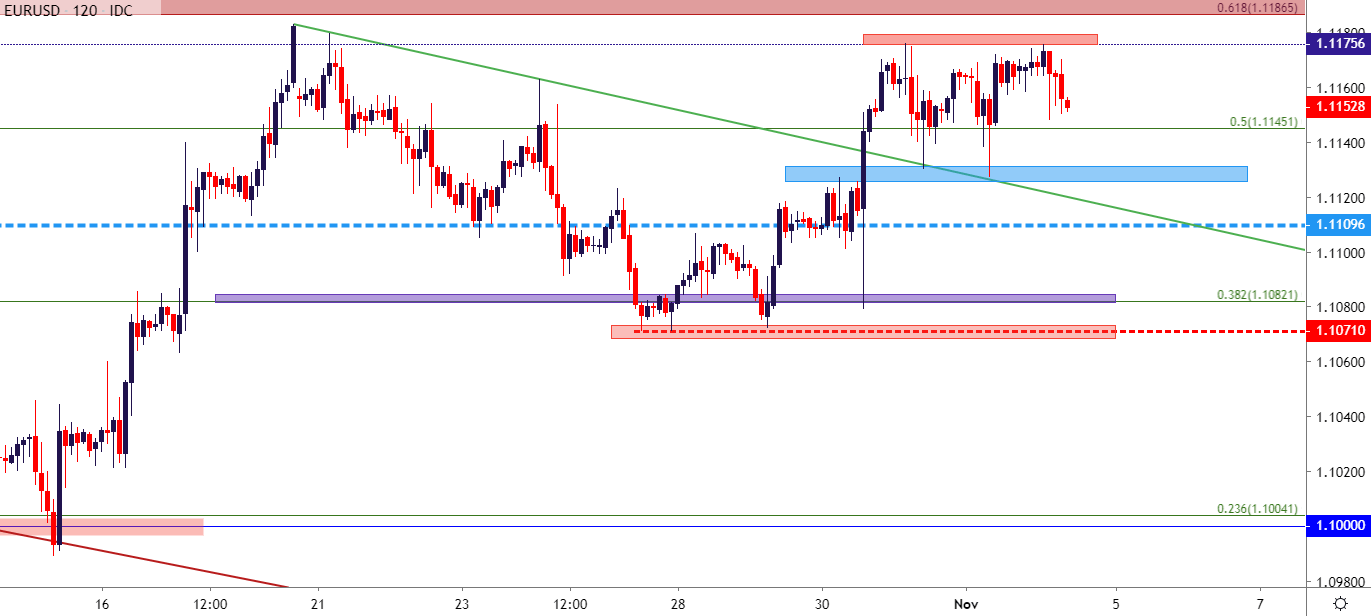
Chart prepared by James Stanley; EURUSD on Tradingview
GBP/USD Shies Away from Another 1.3000 Test
I had looked at this one in this week’s FX Setups, and bullish potential remains in GBP/USD after the strong showing in the month of October. Just ahead, the 1.3000 level looms ominously and buyers haven’t yet shown an ability to take that price out. But, as looked at last week, the door remains open for pullback potential, with battle lines drawn around the 1.2900 level that had previously helped to set resistance. Price action in the pair has so far tip-toed down towards that price in the early-portion of this week, and a support fill may soon be in order.
As noted above, the Bank of England hosts a rate decision on Thursday. This should be very interesting as it’s the first such event since the Brexit breakthrough in September and October; and its also a Super Thursday rate decision meaning that the decision will be coupled with updated forecasts and an accompanying press conference.
GBP/USD Two-Hour Price Chart
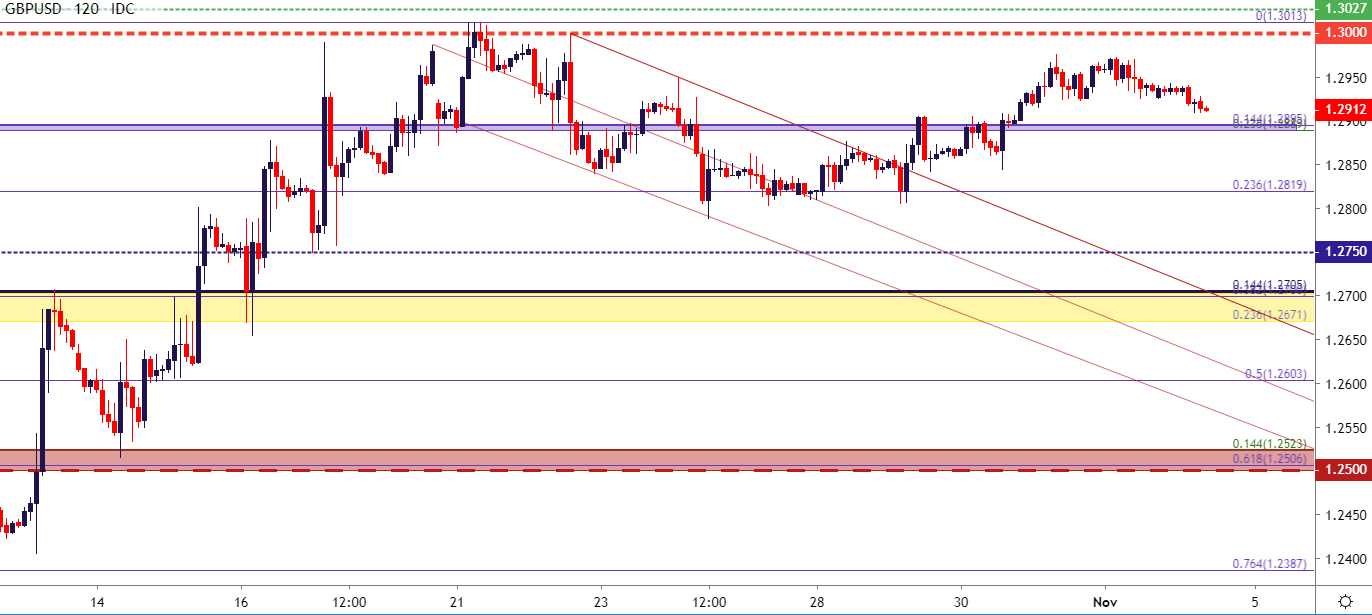
Chart prepared by James Stanley; GBPUSD on Tradingview
USD/CAD Catches at Support
Last week also brought a rate decision out of Canada, with the net results of CAD-weakness showing very prominently against the US Dollar ahead of the FOMC rate decision on Wednesday. In USD/CAD, the pair shot-up to a key level of resistance at 1.3200, and with the downdraft in USD showing just after the Fed, the pair pushed back down to another area of prior resistance around the 1.3132 Fibonacci level. This pair was highlighted in this week’s FX Setups, looking for a push back-down to the 1.3065 area that had come in play last week just ahead of the BoC/FOMC combo.
USD/CAD Four-Hour Price Chart
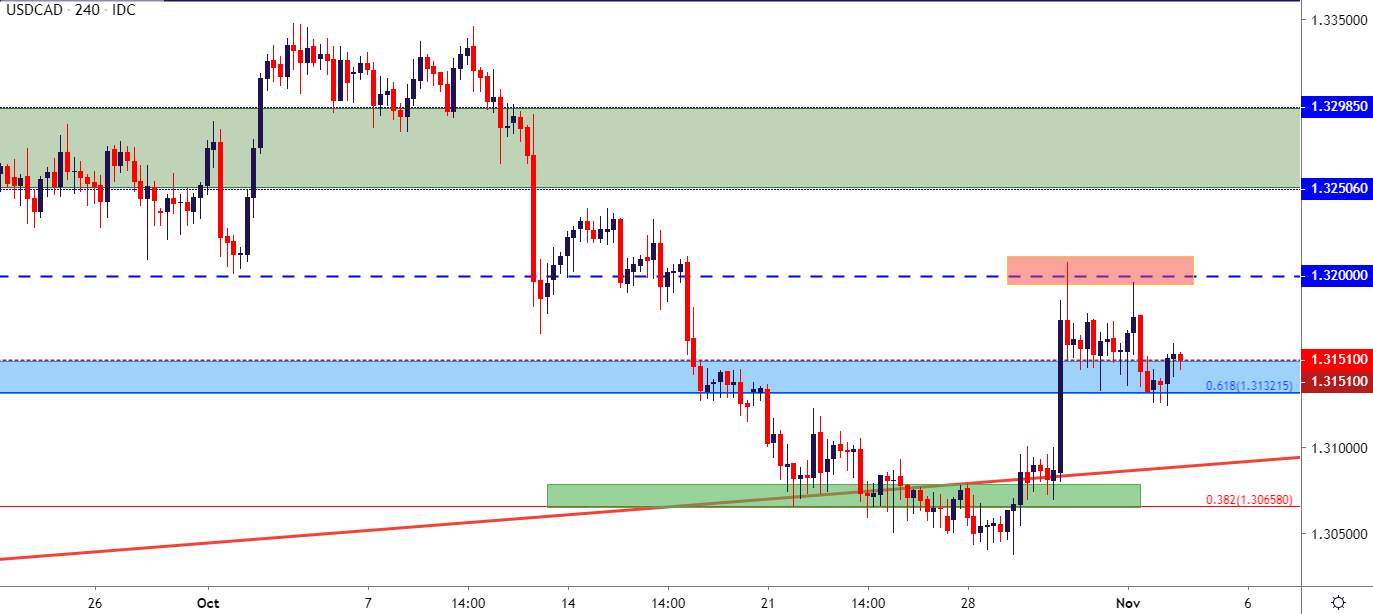
Chart prepared by James Stanley; USDCAD on Tradingview
AUD/USD Resistance Test in the Spotlight Ahead of BoC
On the long-side of the US Dollar, AUD/USD can remain of interest. A rate decision is set to take place later today (early Tuesday morning in Australia) and the backdrop behind the Aussie is very interesting.
The pair has been in hard bearish trends for the better part of the past two years. This eventually led to fresh decade-lows that were set in early-August around the .6700-level which, at this point, has proven a tough support zone to break. Sellers were thwarted there in each of the past three months. And as USD-weakness has taken-over so far in Q4, this has allowed for a retracement in the pair that’s likely at least partially-driven by a short-squeeze.
At this point, price action in AUD/USD is testing a key trendline while working on fresh three-month highs. This trendline already came into play last Thursday to help hold the advance and that level was testing again in the early-portion of this week. Will the RBA bring bears back into the mix? Or is the pair gearing up for a run towards the .7000 big figure that hasn’t been in-play since July?
AUD/USD Daily Price Chart
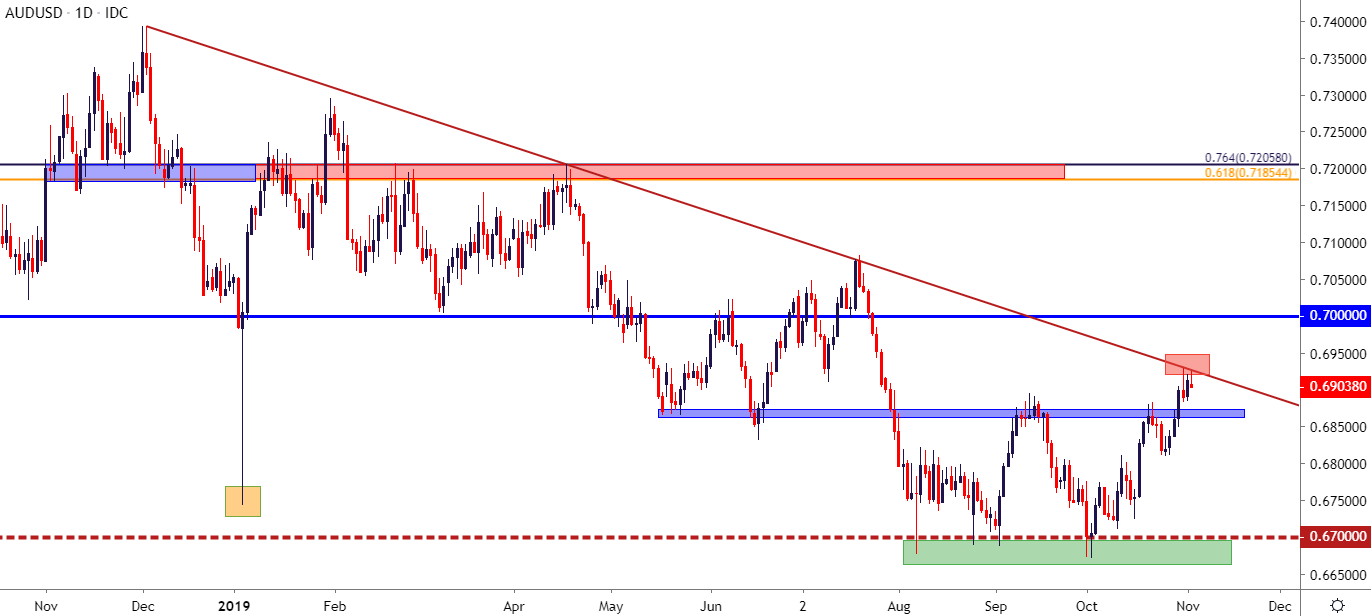
Chart prepared by James Stanley; AUDUSD on Tradingview
To read more:
Are you looking for longer-term analysis on the U.S. Dollar? Our DailyFX Forecasts have a section for each major currency, and we also offer a plethora of resources on Gold or USD-pairs such as EUR/USD, GBP/USD, USD/JPY, AUD/USD. Traders can also stay up with near-term positioning via our IG Client Sentiment Indicator.
Forex Trading Resources
DailyFX offers an abundance of tools, indicators and resources to help traders. For those looking for trading ideas, our IG Client Sentiment shows the positioning of retail traders with actual live trades and positions. Our trading guides bring our DailyFX Quarterly Forecasts and our Top Trading Opportunities; and our real-time news feed has intra-day interactions from the DailyFX team. And if you’re looking for real-time analysis, our DailyFX Webinars offer numerous sessions each week in which you can see how and why we’re looking at what we’re looking at.
If you’re looking for educational information, our New to FX guide is there to help new(er) traders while our Traits of Successful Traders research is built to help sharpen the skill set by focusing on risk and trade management.
--- Written by James Stanley, Strategist for DailyFX.com
Contact and follow James on Twitter: @JStanleyFX


