


FOMC Talking Points:
- Today at 2PM ET brings the FOMC rate decision for the month of October, with the wide-expectation for another 25 basis point rate cut.
- As has become usual, the big driver here will likely be in the details and how that cut comes down. Will Chair Powell frame this cut as yet another ‘insurance rate cut?’
- DailyFX Forecasts are published on a variety of markets such as Gold, the US Dollar or the Euro and are available from the DailyFX Trading Guides page. If you’re looking to improve your trading approach, check out Traits of Successful Traders. And if you’re looking for an introductory primer to the Forex market, check out our New to FX Guide.
Today at 2PM ET brings the FOMC’s rate decision for the month of October and markets are primed for a cut. A cut at this meeting has been long expected and if it does take place, would mark the third such move in as many meetings. This runs in stark contrast to the bank’s stance just a year ago, when in the opening days of Q4 2018 FOMC Chair Jerome Powell remarked that the neutral rate was ‘a long way’ off. This was widely-inferred to mean that the bank had plans for more rate hikes in 2019 but, at this point, rates are 25 basis points below the level they were at when Chair Powell made that statement on October 3 of last year (December 2018 brought another 25 basis point hike). Another cut will make that a 50 basis point deviation and, as has become natural in the era of forward guidance, the big question will be on ‘what’s next?’
In the US Dollar, the currency remained relatively strong through those two prior rate cuts, only beginning to show weakness as the door opened into Q4 of this year. And this was marked by a string of negative data that brought sellers into the mix after the US currency pushed up to a fresh two-year-high to open the quarter. But as missed expectations and slower growth pressures punctuated the headlines the US Dollar dropped by more than 2% in the first-half of October and it would probably be safe to assume that today’s rate cut is adequately priced-in.
Today’s meeting does not bring updated projections or forecasts; for that we’ll have to wait until December. And even in those recent forecasts, a number of questions remain as to whether the bank will actually take on a clearer dovish tone. Up to this point, the bank has pitched each of those rate cuts as ‘insurance’ rate cuts and not necessarily as responsive to the data. But with data turning lower and markets showing a clear intolerance for hawkish policy, as shown in Q4 last year, the big question is what’s next, and when.
The US Dollar comes into today’s FOMC rate decision with an interesting backdrop. The Q4 sell-off saw price action push below a rising wedge formation. This is a formation that will often be approached with the aim of bearish reversals and this is what was looked at in the Q4 Technical Preview on the US Dollar.
US Dollar Daily Price Chart

Chart prepared by James Stanley; US Dollar on Tradingview
Last week saw a bit of recovery after a stern sell-off in the first few weeks of the quarter, and that bounce ran into a confluent area of resistance that runs between two Fibonacci levels at 97.86 and 97.94. That resistance has since helped to hold this week’s highs through two separate tests.
US Dollar Four-Hour Price Chart
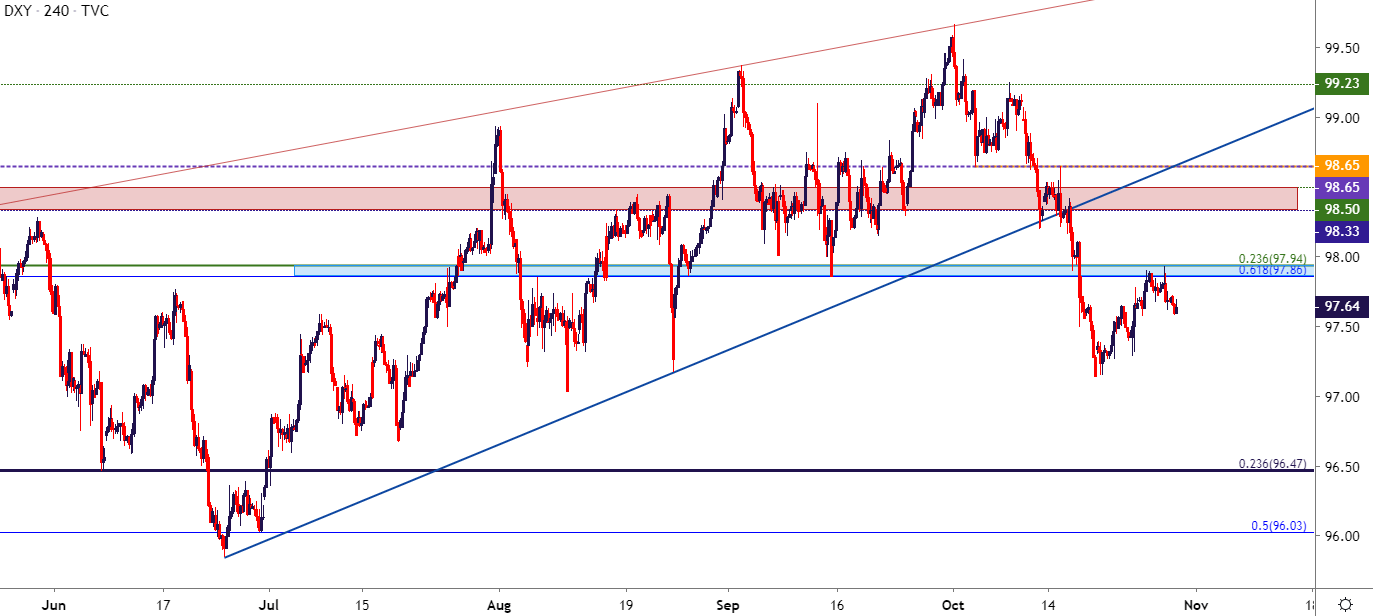
Chart prepared by James Stanley; US Dollar on Tradingview
Will the Fed Signal More Dovish Moves or Stick to Stability?
The big question for today’s meeting is whether the Fed signals another cut. So far, each time the Fed has cut rates they’ve remained evasive about future cuts, with the July move, the first such move in over a decade, leading to a fresh two-year-high in the USD.
Gold prices, however, have appeared to give a strong case of anticipation ahead of this shift, with a bullish breakout showing through Q4 of last year, and getting another extension in June and July, just before the Fed actually decreased rates.
This leads to a bullish continuation theme that’s brought fresh six-year-highs in August and then again in September. Buyers haven’t been able to sustain a move above 1550, however, and as that resistance has set-in price action in Gold has built into a bull flag formation.
If the Fed does signal a softer stance, acknowledges global pressures seeping into the US economy or begins to mention the prospect of more QE, Gold prices could quickly pop and break-above this bull flag. If, however, the Fed sticks to the strains of stability, or tries to, then Gold prices could continue digesting recent gains before bulls show up in anticipation of that eventual dovish move from the FOMC, which would likely be looked for around the December rate decision.
Gold Eight-Hour Price Chart

Chart prepared by James Stanley; Gold on Tradingview
GBP/USD Tests Above Bull Flag After 1.3000 Hit
GBP/USD has had a really strong month of October. I started looking at the bullish side of the pair as a contrarian play in early-August after a long-term trendline came into play. That level finally helped to stem the 2019 decline and September saw buyers step back into the mix. That strength has continued through October trade so far, with the 1.3000 level of resistance coming back into play.
GBP/USD Monthly Price Chart

Chart prepared by James Stanley; GBPUSD on Tradingview
After that 1.3000 price came into play last week, prices have built into a bull flag formation, very similar to the above in Gold albeit a shorter-term variation of that. Price action has begun to budge out of that bearish channel this week with follow-through resistance showing at the 1.2900 level. The big question is whether buyers can pose another re-test of the 1.3000 figure and, if so, whether this iteration sees that resistance give way.
GBP/USD Four-Hour Price Chart

Chart prepared by James Stanley; GBPUSD on Tradingview
USD/JPY for Long-USD Strategies
I started following this one a couple of weeks ago as USD/JPY continued to trend-higher even as the US Dollar was dropping. The pair has since pushed up to fresh two-month-highs, finding resistance at a familiar resistance zone around the 109.00 level. The prior area of resistance, running from 108.47-108.70 has already shown a bit of support this week and price action maintaining above this zone keeps the door open for topside continuation scenarios.
If USD-strength is the net response from today’s rate decision, bullish USD/JPY scenarios remain as attractive, looking for targets in the resistance zone sitting ahead that runs from 109.67-110.00.
USD/JPY Four-Hour Price Chart
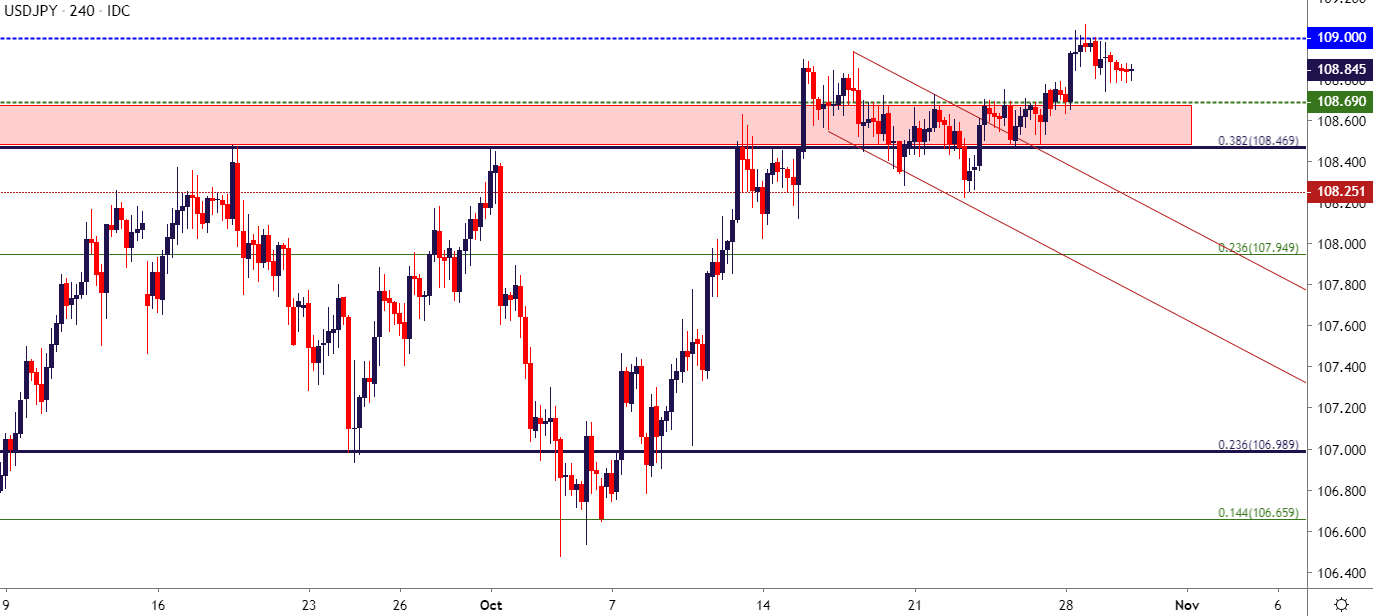
Chart prepared by James Stanley; USDJPY on Tradingview
To read more:
Are you looking for longer-term analysis on the U.S. Dollar? Our DailyFX Forecasts have a section for each major currency, and we also offer a plethora of resources on Gold or USD-pairs such as EUR/USD, GBP/USD, USD/JPY, AUD/USD. Traders can also stay up with near-term positioning via our IG Client Sentiment Indicator.
Forex Trading Resources
DailyFX offers an abundance of tools, indicators and resources to help traders. For those looking for trading ideas, our IG Client Sentiment shows the positioning of retail traders with actual live trades and positions. Our trading guides bring our DailyFX Quarterly Forecasts and our Top Trading Opportunities; and our real-time news feed has intra-day interactions from the DailyFX team. And if you’re looking for real-time analysis, our DailyFX Webinars offer numerous sessions each week in which you can see how and why we’re looking at what we’re looking at.
If you’re looking for educational information, our New to FX guide is there to help new(er) traders while our Traits of Successful Traders research is built to help sharpen the skill set by focusing on risk and trade management.
--- Written by James Stanley, Strategist for DailyFX.com
Contact and follow James on Twitter: @JStanleyFX


