


WTI Crude Oil Talking Points:
- WTI crude oil prices remain in the bear flag formation that’s built through much of October trade, with a key zone of resistance coming into play on Monday of this week.
- As looked at last week, the bullish channel in that flag formation started after a strong zone of support showed earlier this month. That was the third test of this zone since June – are sellers nearing the approach that finally breaks-below?
- DailyFX Forecasts are published on a variety of markets such as Gold, the US Dollar or the Euro and are available from the DailyFX Trading Guides page. If you’re looking to improve your trading approach, check out Traits of Successful Traders. And if you’re looking for an introductory primer to the Forex market, check out our New to FX Guide.
Crude Oil Digestion Continues After September Sell-Off
It seems much longer than a month ago that Saudi oil production was attacked by drones, causing a strong bullish gap at the weekly open in mid-September. WTI crude oil prices flickered with strength for a day, moving up for a test above the 63-level. But that theme was priced-out very quickly and by the end of the month price action was carving out fresh monthly lows. That theme of weakness hung around through the opening days of October with prices eventually finding support in the same zone that’s held the lows throughout the summer.
This area of prices runs between two Fibonacci levels at 50.54 and 51.70, with the former of those prices functioning as the 23.6% retracement of the Q4 2018 sell-off and the latter as the 61.8% marker of the December-April recovery move.
WTI Crude Oil Daily Price Chart
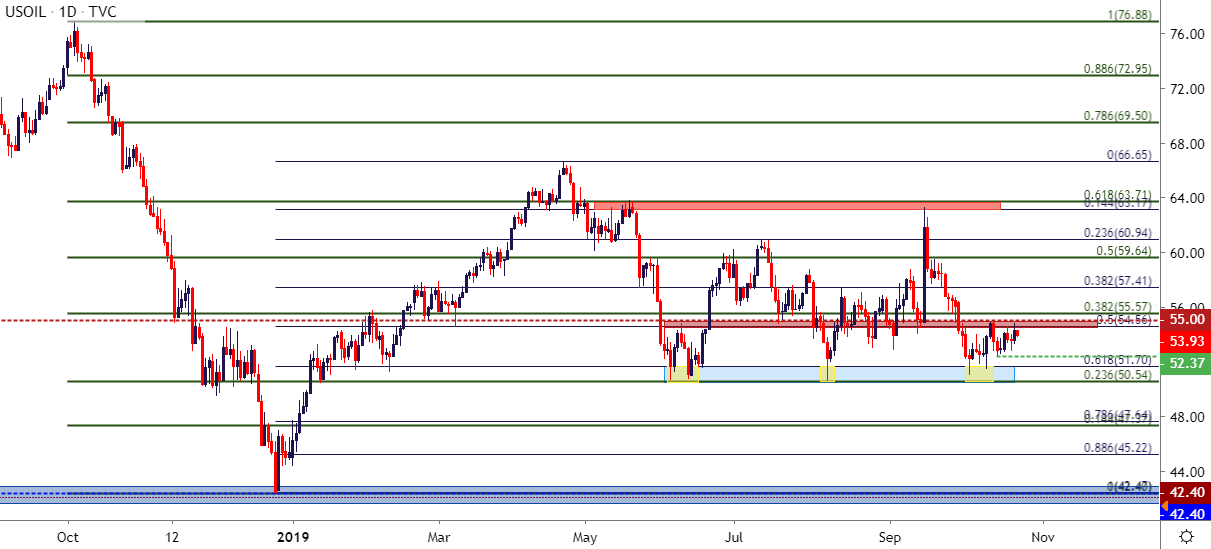
Chart prepared by James Stanley; Crude Oil on Tradingview
As looked at a couple of weeks ago, that early-October support test saw another iteration of buyers responding, pushing prices higher in a rather consistent fashion allowing for the build of a bullish trend channel. This bullish trend channel, when combined with the prior bearish trend, makes for a bear flag formation that will often be approached with the aim of short-side continuation.
Another key zone of interest can be found from one of the above Fibonacci studies, with a resistance area running between 54.56 (the 50% marker of the recovery move) and running up to the 55 psychological level. That zone was looked at last week for resistance potential, opening the door for short-side setups that may allow for a break-down below the bear flag and, eventually, another test of that key support zone sitting above the 50-handle.
WTI Crude Oil Four-Hour Price Chart

Chart prepared by James Stanley; Crude Oil on Tradingview
WTI Crude Oil Big Picture
The more interesting scenario here isn’t looking for a mere $3-4 move. It’s the potential for that support zone that’s held the lows over the last four months to finally give way, which can open the door to another longer-term zone of support sitting below.
The 42-handle has held support in WTI crude oil prices for three years now, coming into play yet again last December in the midst of that aggressive sell-off in oil prices. A breakout below 50 can open the door for another test of that key zone and that’s where matters get interesting as a vacuum of price action sits below that area.
WTI Crude Oil Weekly Price Chart
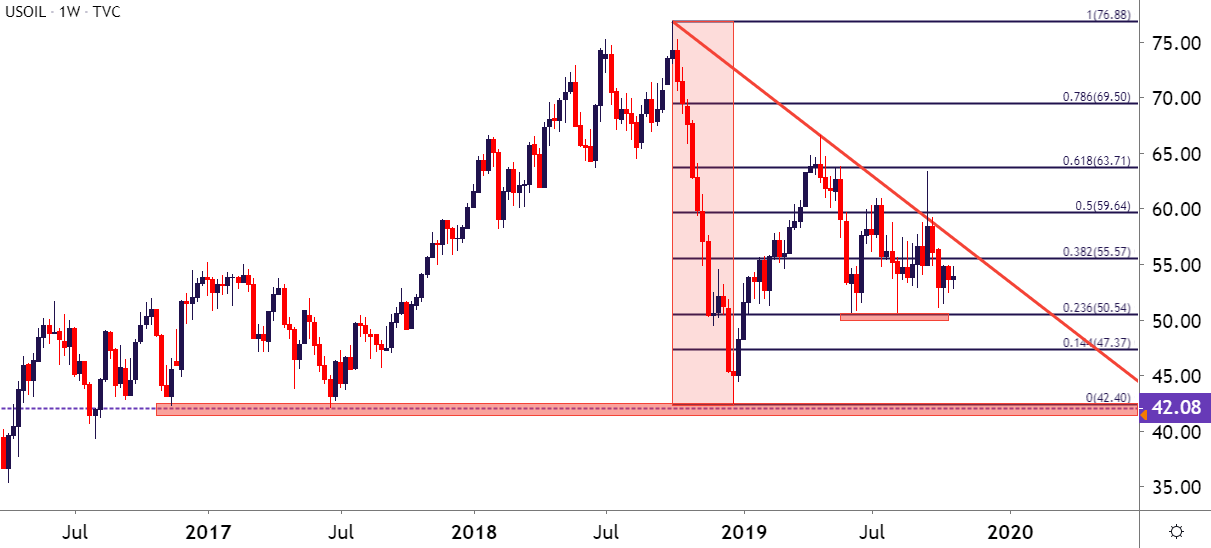
Chart prepared by James Stanley; Crude Oil on Tradingview
To read more:
Are you looking for longer-term analysis on the U.S. Dollar? Our DailyFX Forecasts have a section for each major currency, and we also offer a plethora of resources on Gold or USD-pairs such as EUR/USD, GBP/USD, USD/JPY, AUD/USD. Traders can also stay up with near-term positioning via our IG Client Sentiment Indicator.
Forex Trading Resources
DailyFX offers an abundance of tools, indicators and resources to help traders. For those looking for trading ideas, our IG Client Sentiment shows the positioning of retail traders with actual live trades and positions. Our trading guides bring our DailyFX Quarterly Forecasts and our Top Trading Opportunities; and our real-time news feed has intra-day interactions from the DailyFX team. And if you’re looking for real-time analysis, our DailyFX Webinars offer numerous sessions each week in which you can see how and why we’re looking at what we’re looking at.
If you’re looking for educational information, our New to FX guide is there to help new(er) traders while our Traits of Successful Traders research is built to help sharpen the skill set by focusing on risk and trade management.
--- Written by James Stanley, Strategist for DailyFX.com
Contact and follow James on Twitter: @JStanleyFX


