


US Dollar Talking Points:
- The US Dollar remains near resistance in a short-term range that’s built over the past three weeks, through a number of key drivers.
- This sets the stage for what could be a contentious Q4, with focus set squarely on the Federal Reserve for any grander moves of dovishness.
- DailyFX Forecasts are published on a variety of markets such as Gold, the US Dollar or the Euro and are available from the DailyFX Trading Guides page. If you’re looking to improve your trading approach, check out Traits of Successful Traders. And if you’re looking for an introductory primer to the Forex market, check out our New to FX Guide.
As we trade deeper into the final week of Q3 the US Dollar remains in a non-directional near-term state, testing resistance that’s held over the past few weeks following the flare of strength to kick off the month. Much has happened during this period, including an ECB stimulus announcement and another FOMC rate cut. But, as yet, nothing has been able to spur a strong directional move in the Greenback as the quarter moves towards close. This places considerable emphasis on Fed-speak in the month of October as well as US data as traders look for evidence of greater slowdown in the world’s largest national economy.
Until then, the near-term range in the US Dollar remains.
US Dollar Four-Hour Price Chart
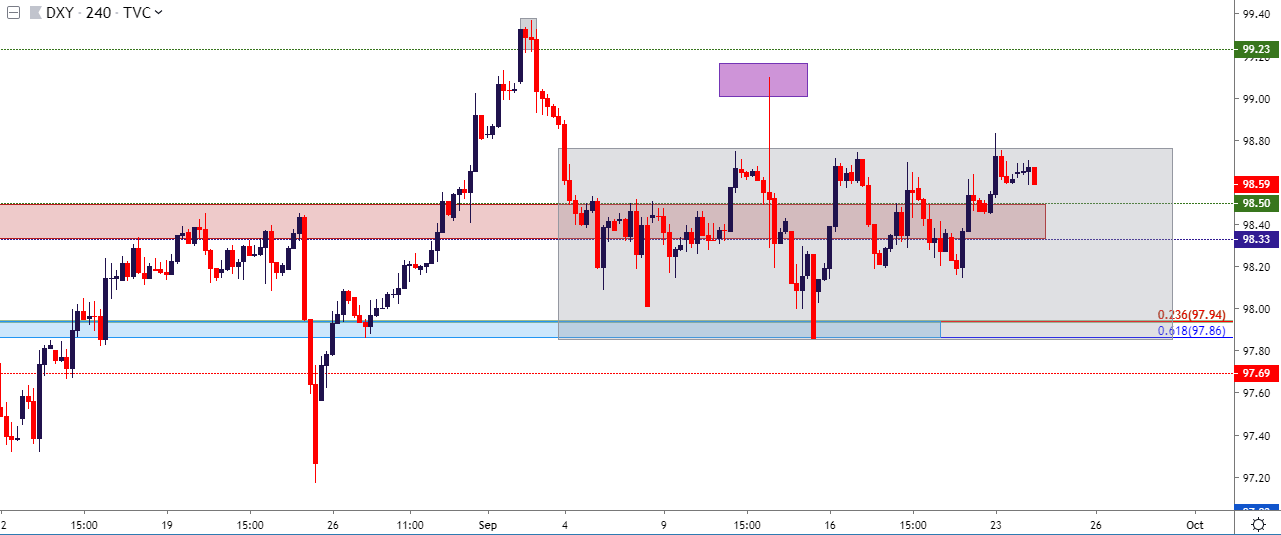
Chart prepared by James Stanley; US Dollar on Tradingview
EUR/USD Finds Resistance at 1.1000 – Can Sellers Break-Away?
Given the events in the latter-half of September, it might be surprising that EUR/USD has been unable to push down to a fresh low. But, after setting a fairly aggressive bear trap earlier in the month, sinking to fresh lows amidst holiday-thin liquidity conditions, EUR/USD put in a higher-low around the ECB rate announcement. This led to a slingshot move of almost 200 pips as prices jumped up to a confluent resistance area around the prior low of 1.1109. Since then, sellers have been making another push into the Q4 open, creating a series of lower-lows and lower-highs, including the early-week push below the 1.1000 psychological level. That price has since come back to show a bit of near-term resistance, but can sellers continue to push?
If there is a push above the 1.1000 level, the area around 1.1025 may be a bit more amenable for staging short-side approaches, and if that doesn’t hold, resistance could be sought out around the bearish trendline projection that currently syncs up around the 1.1075 swing high.
EUR/USD Four-Hour Price Chart
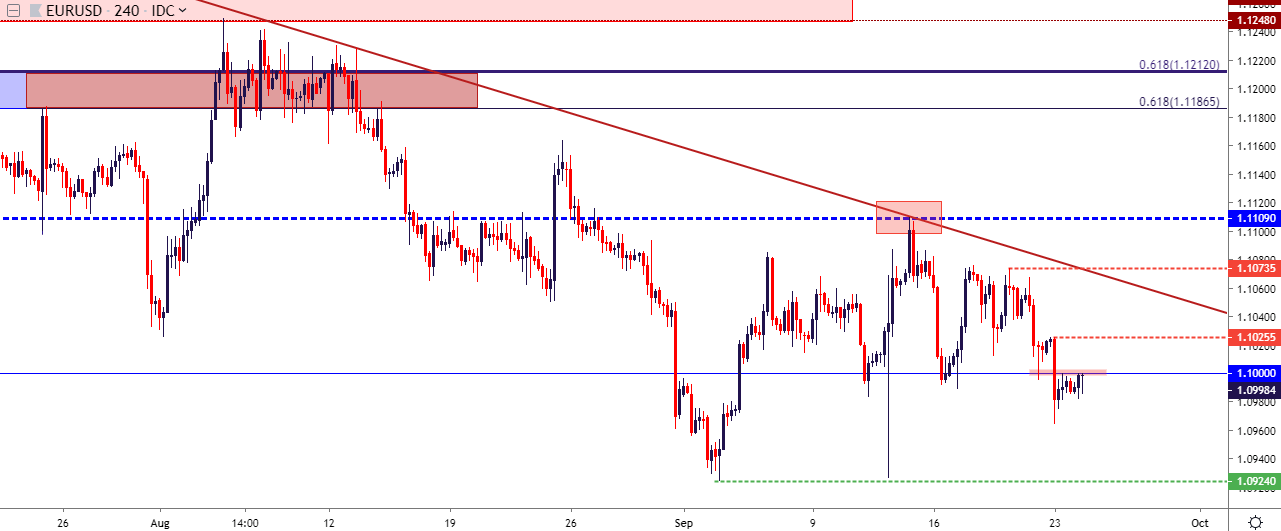
Chart prepared by James Stanley; EURUSD on Tradingview
GBP/USD: Cable September Strength – Can it Continue?
The second half of Q3 has seen an interesting theme develop in the British Pound. The currency was in the midst of a brutal downtrend coming into the period, with sellers controlling the move through July trade. GBP/USD pushed down to a fresh two-year-low on the first day of August, and then spent the rest of the month trying to cauterize support from a long-term trendline taken from lows in 1985 and 2016. After a grind through last month, buyers finally started to take-control in September and prices have since rallied by more than 500 pips off of the lows.
Can buyers continue to take a stand as the door opens into Q4?
GBP/USD Eight-Hour Price Chart
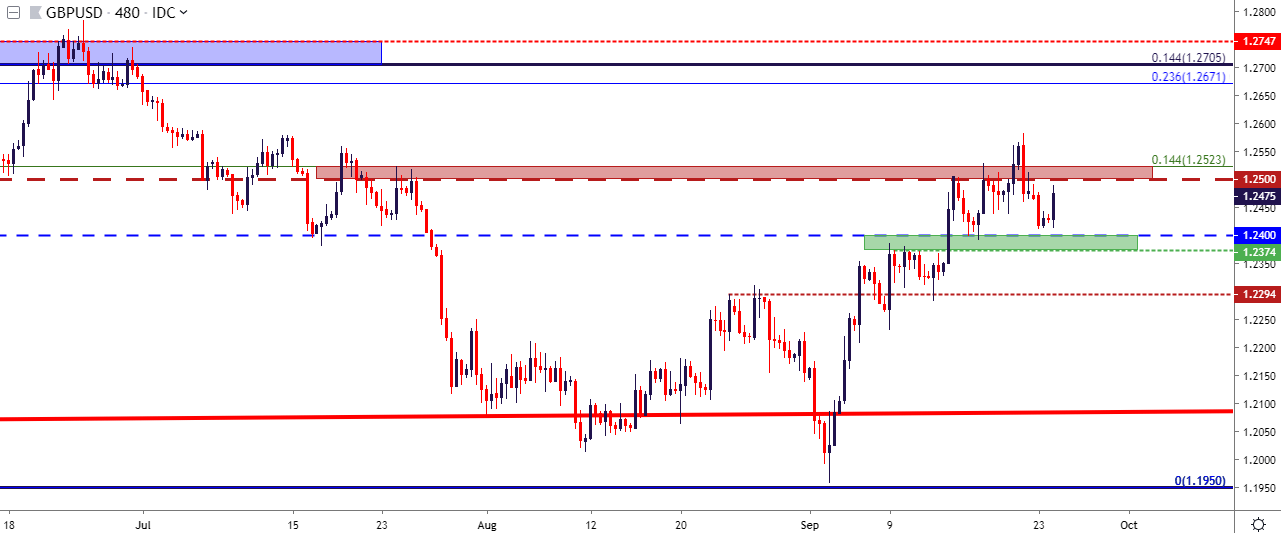
Chart prepared by James Stanley; GBPUSD on Tradingview
USD/CAD: Which Trend Comes Next?
On the short-side of the US Dollar, USD/CAD remains of interest. The pair put in a strong sell-off to start the month of September, coming after a strong reversal setup earlier in the month. Price action pushed all the way down to the support zone that runs from 1.3132-1.3150, and that zone provided a bounce to the pair with prices running right back to the 1.3250-1.3300 zone on the chart. That zone has now been in-play for a little more than a week, highlighting an equalization of that prior bid pressure that pushed prices into this area. This can keep USD/CAD as a compelling option for bearish USD-scenarios into the Q3 close.
USD/CAD Four-Hour Price Chart
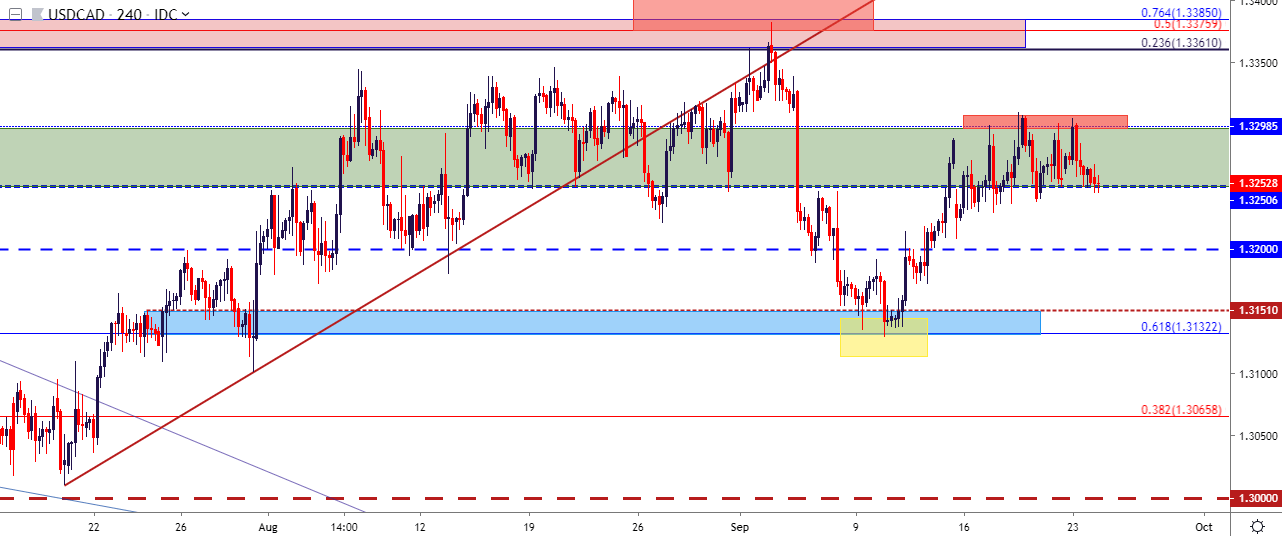
Chart prepared by James Stanley; USDCAD on Tradingview
AUD/USD Pushes for Resistance – Will Sellers Respond?
On the long side of the US Dollar, AUD/USD can remain as interesting. I had looked into the pair for bearish scenarios a couple of weeks ago after a key zone of resistance came into play. Sellers took a fairly strong swing last week, pushing down to fresh two-week-lows around the .6760 support level. That has since led into a bounce in the early-portion of this week with a resistance zone lurking from .6809-.6829 fast nearing.
Given the veracity of the downtrend in the pair coming into September, combined with this recent retracement and re-ignition of the bearish drive, and focus could remain on the short-side of AUD/USD, presenting one of the more compelling options for USD-strength amongst the majors.
AUD/USD Two-Hour Price Chart
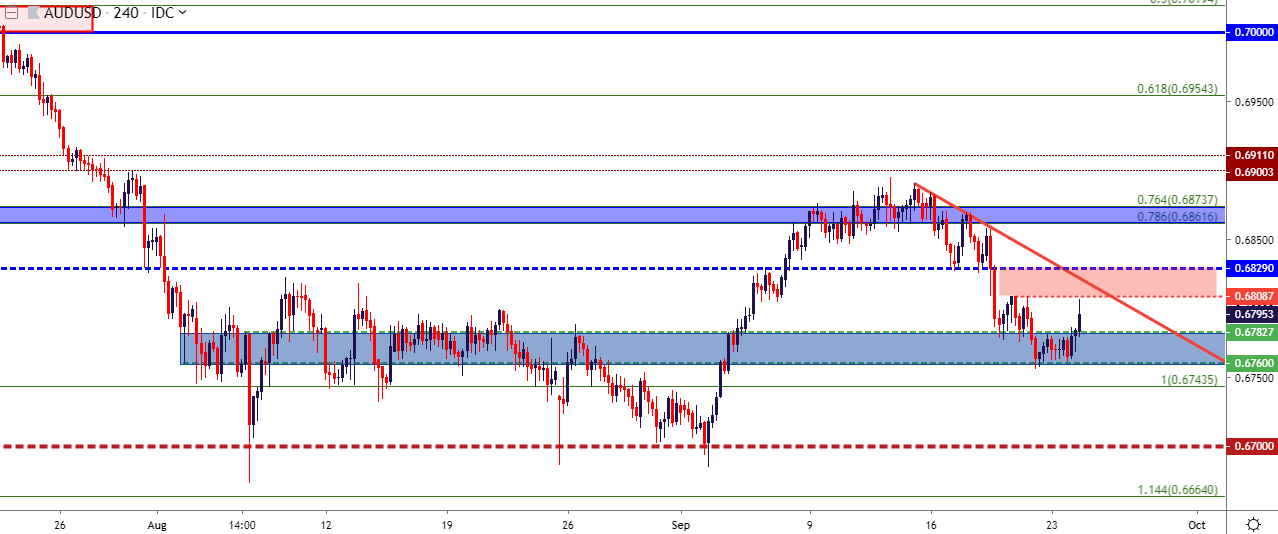
Chart prepared by James Stanley; AUDUSD on Tradingview
To read more:
Are you looking for longer-term analysis on the U.S. Dollar? Our DailyFX Forecasts have a section for each major currency, and we also offer a plethora of resources on Gold or USD-pairs such as EUR/USD, GBP/USD, USD/JPY, AUD/USD. Traders can also stay up with near-term positioning via our IG Client Sentiment Indicator.
Forex Trading Resources
DailyFX offers an abundance of tools, indicators and resources to help traders. For those looking for trading ideas, our IG Client Sentiment shows the positioning of retail traders with actual live trades and positions. Our trading guides bring our DailyFX Quarterly Forecasts and our Top Trading Opportunities; and our real-time news feed has intra-day interactions from the DailyFX team. And if you’re looking for real-time analysis, our DailyFX Webinars offer numerous sessions each week in which you can see how and why we’re looking at what we’re looking at.
If you’re looking for educational information, our New to FX guide is there to help new(er) traders while our Traits of Successful Traders research is built to help sharpen the skill set by focusing on risk and trade management.
--- Written by James Stanley, Strategist for DailyFX.com
Contact and follow James on Twitter: @JStanleyFX


