


US Dollar Talking Points:
- The US Dollar has snapped back from the Labor Day breakout that started last Friday and ran into yesterday morning.
- The month of September is huge as the Q4 open approaches, as there are key Central Bank rate decisions from both the ECB and the FOMC. Later today brings the Bank of Canada into the mix, and this Friday brings employment numbers out of both the US and Canada. Buckle up.
- DailyFX Forecasts are published on a variety of markets such as Gold, the US Dollar or the Euro and are available from the DailyFX Trading Guides page. If you’re looking to improve your trading approach, check out Traits of Successful Traders. And if you’re looking for an introductory primer to the Forex market, check out our New to FX Guide.
US Dollar Snaps Back
It’s been a riveting past few days of price action in the US Dollar, with perhaps a bit of a trap presenting itself. Last Friday saw an aggressive breakout take place with a low-liquidity backdrop ahead of the Labor Day holiday in the US. The first trading day of September was on Monday during that holiday, and the Dollar continued to push up to fresh two-year-highs while US markets were closed. That strength finally met its match yesterday when US traders returned to their desks, and 24 hours that bullish breakout is almost entirely erased. I had warned of this scenario on Friday afternoon in the Zero Hedge article entitled, USD Hits Two-Year-Highs, EUR/USD Crosses 1.1000 and the S&P Holds at Resistance.
US Dollar Four-Hour Chart: The Bullish Breakout Snaps Back

Chart prepared by James Stanley; US Dollar on Tradingview
Taking a step back and the spot from where this took place is rather key. The Dollar had surged up to fresh two-year-highs yesterday, and this is with an FOMC rate decision on the economic calendar two weeks away in which the bank is widely-expected to cut rates again while opening the door for more cuts later in the year, at rate meetings in October and/or December.
As looked at in yesterday’s webinar, price action in the US Dollar printed as a pin bar on the Daily chart. Such formations can be very interesting for reversals and, so far, that scenario has continued to play out, with the body of the bar pivoting around a trendline projection that makes up the topside of a rising wedge formation.
US Dollar Daily Price Chart
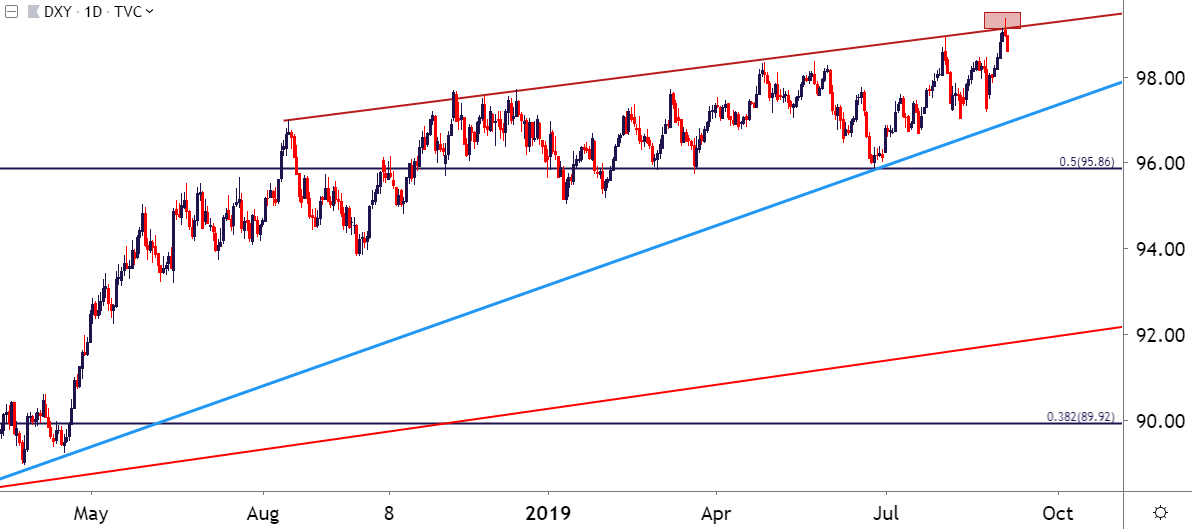
Chart prepared by James Stanley; US Dollar on Tradingview
EUR/USD Snaps Back Above 1.1000 – How Bearish Do You Want to Be?
Getting bearish on a pair selling off isn’t very difficult. What is more complicated is plotting appropriate entry in such a matter. That was the scenario in EUR/USD from Friday through Monday as the breakdown in the pair was sudden and aggressive, with a minimum of pullback to allow for short-side entries.
But – what has become a bit more noticeable has been various ECB speakers talking-down the prospect of a ‘significant’ QE package, similar to what Olli Rehn had warned of just last month. This, combined with the pullback in the US Dollar, has put Euro bears in the spotlight. The Daily chart of EUR/USD is currently showing a morning star reversal pattern, which will often be approached in a bullish manner. But – prices are now testing short-term resistance and for those that want to be bearish in the pair, this is an interesting spot to investigate for staging short-side approaches.
EUR/USD Daily Price Chart
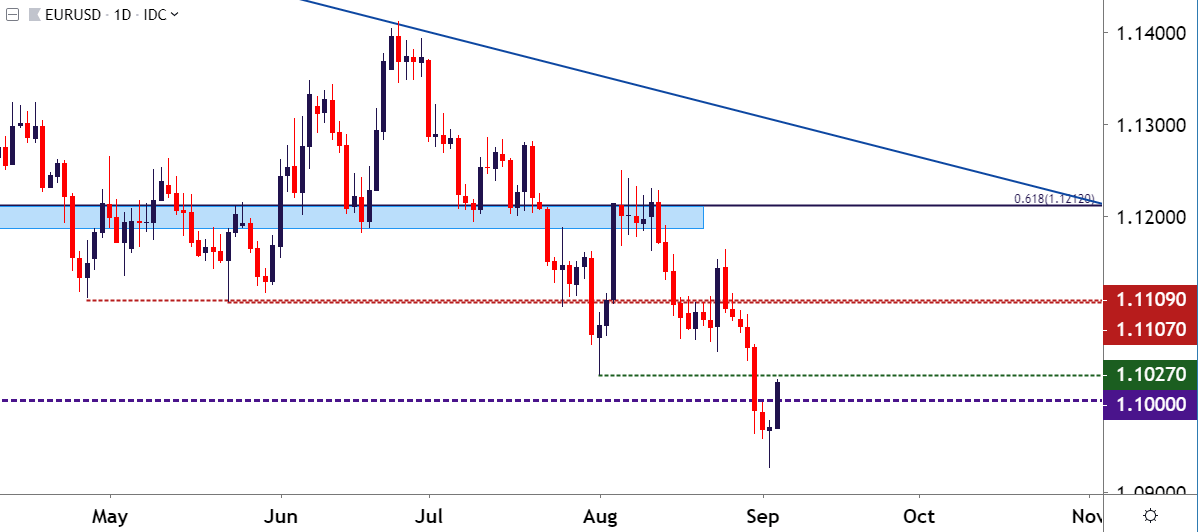
Chart prepared by James Stanley; EURUSD on Tradingview
GBP/USD Rallies Higher
A similar reversal has shown in GBP/USD and, in perhaps a stroke of lucky timing, earlier this morning I had an article published on IG.com asking if the GBP/USD has finally found its low. That article was actually authored on Friday, looking to the monthly close in the pair after a long-term trend-line had come into play. This, of course, hasn’t set the exact lows but it has helped buyers to base a bit of support as prices are now rushing higher. Similar to EUR/USD above, a morning star has printed on the Daily chart. But, as looked at in yesterday’s webinar, USD-strength strategies don’t look nearly as attractive here as the GBP/USD pair appears primed for USD-weakness.
GBP/USD Hourly Price Chart

Chart prepared by James Stanley; GBPUSD on Tradingview
USD/CAD Reverses from Key Zone
I’ve been following USD/CAD for reversals over the past few weeks and while there were a few stutter steps, sellers remained at bay given the profuse USD-strength. But – as looked at in yesterday’s webinar, that prospect of capitulation that I had been looking for may have finally shown.
USD/CAD posed a bullish breakout to test a big zone of resistance that runs from 1.3361-1.3385. That zone is what helped to bring bears back into the mix and, so far, that theme has held with the pair continuing to drop. Later today brings the Bank of Canada rate decision and on Friday, Canadian employment numbers.
USD/CAD Eight-Hour Price Chart
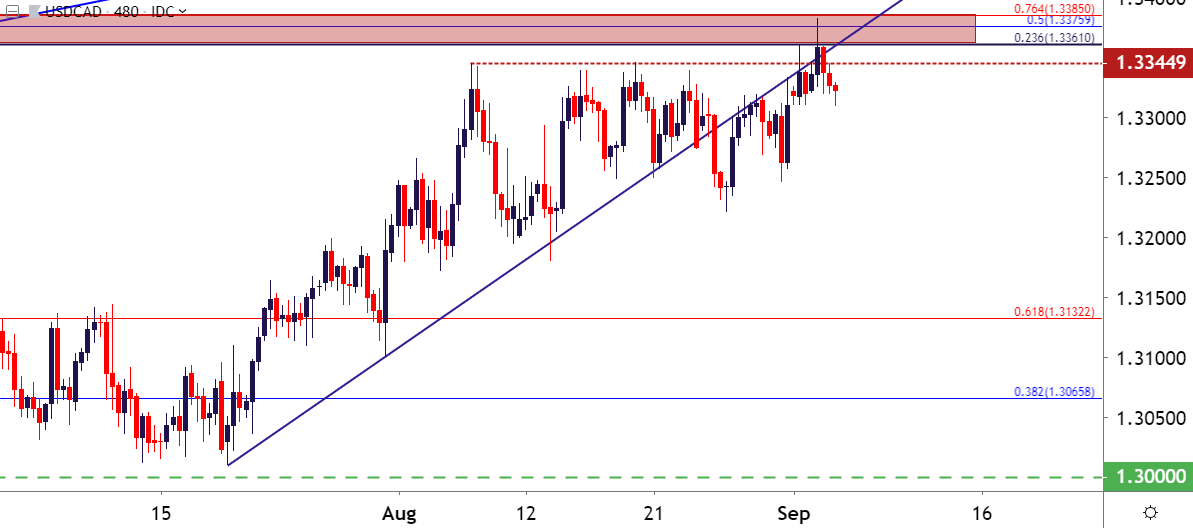
Chart prepared by James Stanley; USDCAD on Tradingview
AUD/USD Snaps Back to Resistance
For those that do want to use this pullback in the US Dollar as an opportunity to buy – AUD/USD can remain of interest. The pair has been oversold for some time now so this recent flicker of weakness in the Greenback has helped prices to pullback. A key area of resistance is nearing around the .6800 handle, and a hold there can keep the door open for short-side AUD/USD strategies.
AUD/USD Eight-Hour Price Chart
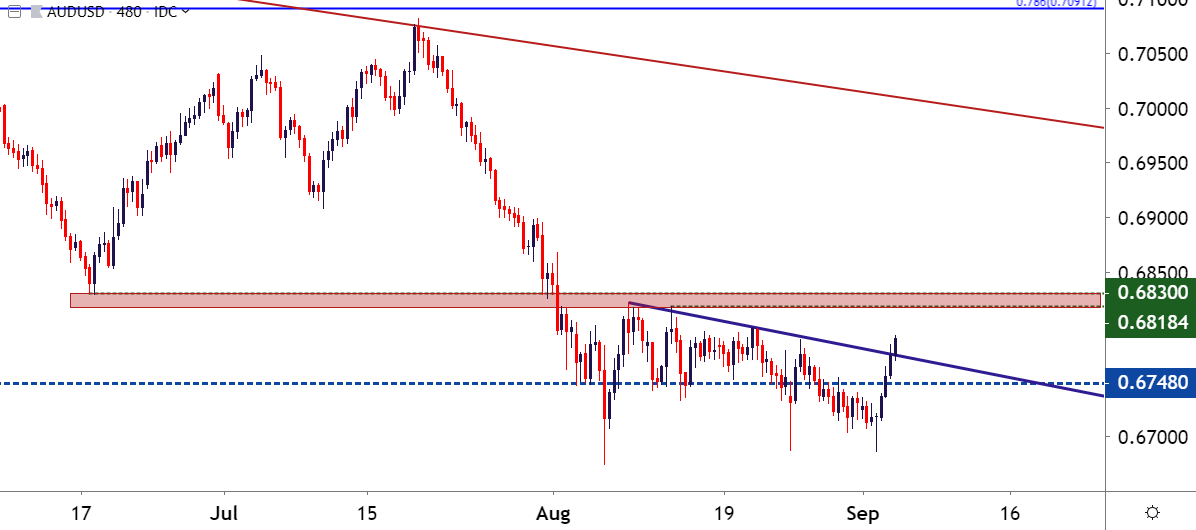
Chart prepared by James Stanley; AUDUSD on Tradingview
To read more:
Are you looking for longer-term analysis on the U.S. Dollar? Our DailyFX Forecasts have a section for each major currency, and we also offer a plethora of resources on Gold or USD-pairs such as EUR/USD, GBP/USD, USD/JPY, AUD/USD. Traders can also stay up with near-term positioning via our IG Client Sentiment Indicator.
Forex Trading Resources
DailyFX offers an abundance of tools, indicators and resources to help traders. For those looking for trading ideas, our IG Client Sentiment shows the positioning of retail traders with actual live trades and positions. Our trading guides bring our DailyFX Quarterly Forecasts and our Top Trading Opportunities; and our real-time news feed has intra-day interactions from the DailyFX team. And if you’re looking for real-time analysis, our DailyFX Webinars offer numerous sessions each week in which you can see how and why we’re looking at what we’re looking at.
If you’re looking for educational information, our New to FX guide is there to help new(er) traders while our Traits of Successful Traders research is built to help sharpen the skill set by focusing on risk and trade management.
--- Written by James Stanley, Strategist for DailyFX.com
Contact and follow James on Twitter: @JStanleyFX


