


Gold Price Talking Points:
- Gold prices remain overbought from a variety of vantage points but, as looked at last week, that hasn’t seemed to matter much.
- As both economic and political risks are flaring around-the-globe, capital has pushed into Gold as the expected response is even more Central Bank softening.
- DailyFX Forecasts are published on a variety of markets such as Gold, the US Dollar or the Euro and are available from the DailyFX Trading Guides page. If you’re looking to improve your trading approach, check out Traits of Successful Traders. And if you’re looking for an introductory primer to the Forex market, check out our New to FX Guide.
Gold Prices Back Above 1500
Gold prices have remained bid over the past week, setting another fresh six-year-high in early-Tuesday trade. Last week, I pointed out that Gold prices were at their most overbought since 2011 with the big question being whether that mattered. At this point, it hasn’t, and Gold remains as one of the strongest trends on traders’ charts as the Gold rush has continued.
At the source of the move is a rather potent cocktail of drivers. Global stress is contributing, surely, but it’s the responses and expected reactions to those stressors that’s likely the more important factor. Trade wars, political strife and slowing economic growth are all working in concert to drive global Central Banks into a more dovish posture, similar to what was seen after the global financial collapse. This has brought on lower bond yields and, in the US, a case of yield curve inversion that doesn’t usually portend a positive story. Gold prices have remained attractive through it all.
Gold Daily Price Chart
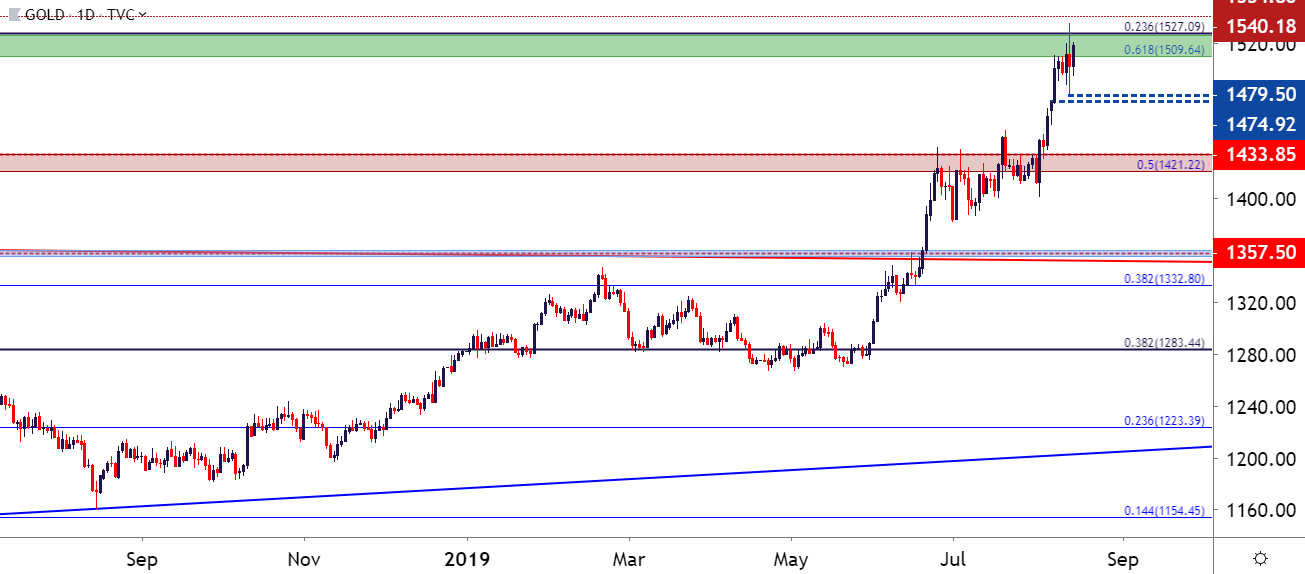
Chart prepared by James Stanley; Gold on Tradingview
While the trend has been quite clear and the driving force of that move very logical; the primary complication with working with Gold prices at the moment is one of strategy. Each pullback has been aggressively bid by buyers on the sidelines that have been waiting to join the move and this has further contributed to an even more overbought state. So, what’s a risk averse trader to do?
In the article published last Thursday, I had looked at support potential around the 1490 level, and this came into play on Monday of this week. After that support set, prices ripped-higher by $45 by Tuesday morning, setting that fresh six-year-high.
This move quickly reversed yesterday morning on news that some tariffs on China would be delayed; initially expected to come into effect on September 1 and now coming into play on December 15th. There was also an item of positivity from the Chinese side, as China said that talks would take place with the US, over the phone, in two weeks. This led to a quick sell-off as Gold prices perched down to 1480 but, similar to other sell-offs in the recent past, buyers were waiting on the sideline to pounce, pushing prices right back above the 1500 marker.
Gold Price Hourly Chart
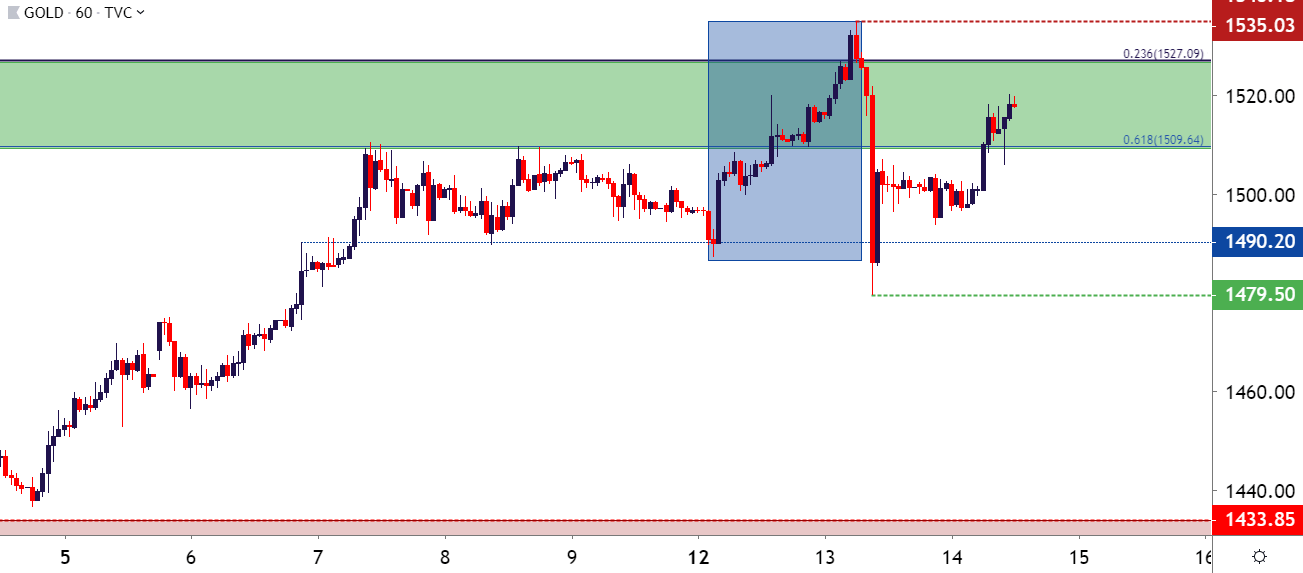
Chart prepared by James Stanley; Gold on Tradingview
Gold Price Strategy Moving Forward
At this point, there could be a few different ways of approaching the topside of Gold. Using outside price action traders can look for further breakout potential, waiting for a print of another fresh six-year-high to open the door to bullish continuation scenarios. There’s a prior support swing around the 1540 level that could be used for an initial target, at which point stops can be adjusted to break-even in-case the bullish breakout doesn’t hold.
Gold Price Weekly Chart

Chart prepared by James Stanley; Gold on Tradingview
Alternatively, traders can look to play pullbacks and the 1500 level is of interest as it helped to slow the move on the way up but, as yet, hasn’t shown much for support. Below that, another area of support potential exists from around 1475-1480 which could similarly be utilized for bullish trend plays. And below that, another potential support zone comes into the equation around the 1453 level which, similar to 1500, showed some decent resistance on the way up but has yet to show higher-low support.
Gold Price Four-Hour Chart
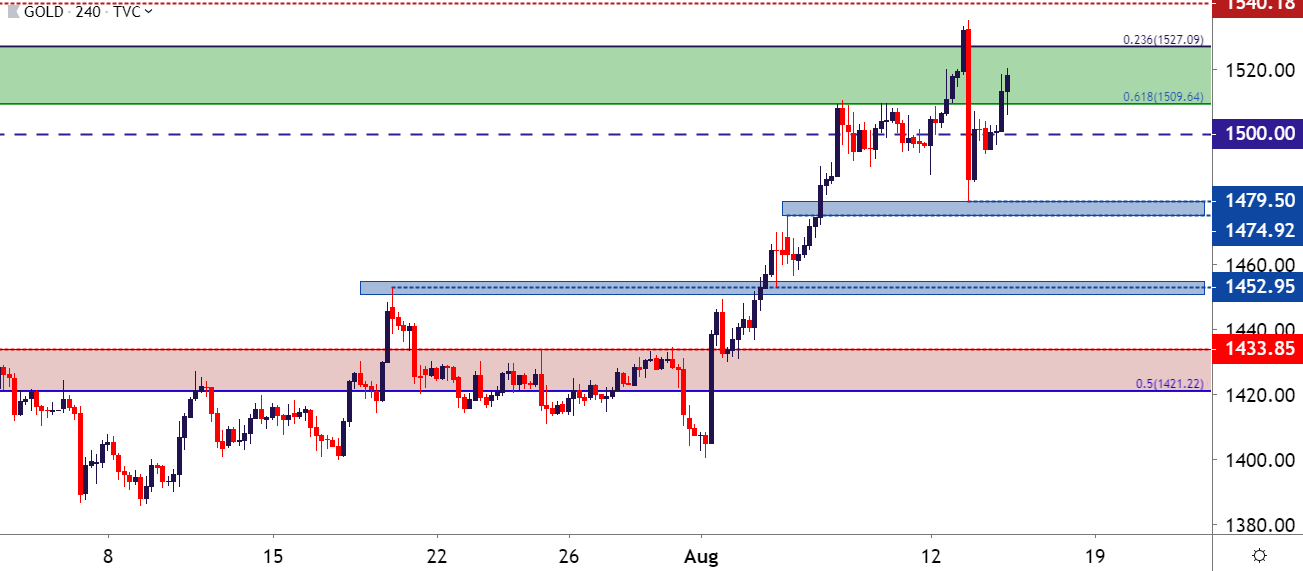
Chart prepared by James Stanley; Gold on Tradingview
To read more:
Are you looking for longer-term analysis on the U.S. Dollar? Our DailyFX Forecasts have a section for each major currency, and we also offer a plethora of resources on Gold or USD-pairs such as EUR/USD, GBP/USD, USD/JPY, AUD/USD. Traders can also stay up with near-term positioning via our IG Client Sentiment Indicator.
Forex Trading Resources
DailyFX offers an abundance of tools, indicators and resources to help traders. For those looking for trading ideas, our IG Client Sentiment shows the positioning of retail traders with actual live trades and positions. Our trading guides bring our DailyFX Quarterly Forecasts and our Top Trading Opportunities; and our real-time news feed has intra-day interactions from the DailyFX team. And if you’re looking for real-time analysis, our DailyFX Webinars offer numerous sessions each week in which you can see how and why we’re looking at what we’re looking at.
If you’re looking for educational information, our New to FX guide is there to help new(er) traders while our Traits of Successful Traders research is built to help sharpen the skill set by focusing on risk and trade management.
--- Written by James Stanley, Strategist for DailyFX.com
Contact and follow James on Twitter: @JStanleyFX


