


US Dollar Price Outlook Talking Points:
- The US Dollar put in a bearish theme in the month of June around a dovish flip at the FOMC; running in contrast to the bullish backdrop that showed in the currency for much of the 15 months prior. Can sellers continue to push the Greenback lower as the Q3 open nears?
- While the Fed may still not be as dovish as Central Banks in Europe or Japan, those themes are far older and less surprising. There may be more room for themes of USD-weakness to get priced in as investors grapple with whether the Fed will actually cut rates in 2H 2019.
- DailyFX Forecasts are published on a variety of markets such as Gold, the US Dollar or the Euro and are available from the DailyFX Trading Guides page. If you’re looking to improve your trading approach, check out Traits of Successful Traders. And if you’re looking for an introductory primer to the Forex market, check out our New to FX Guide.
US Dollar Bears Come into Play to Cap Q2 Trade
This is the final trading day for the first-half of 2019 and it’s already been an interesting year across global markets. The risk slump from Q4 carried some ramifications into 2019 trade as a strong bullish theme that ran into April started to come into question in the month of May. The big driver around that pivot appeared to be the Fed, as it was the FOMC’s rate decision that concluded on May 1 that led to a large sell-off in stocks that stuck around for pretty much the entirety of last month.
It wasn’t until comments from FOMC Chair Jerome Powell in early-June that equity markets started to find support, and this is also around the time that matters began to impact the FX-world as allusions to more dovish policy out of the Fed started to hit the US Dollar. As risk markets came back to life, punctuated by strong topside moves in markets like Gold to go along with US stocks, the US Dollar dropped with aggression throughout the month of June, breaking below a rising wedge formation along the way. Something like this will often be approached with bearish aim, and the big question for Q3 is whether USD bears might be able to continue driving matters.
US Dollar Weekly Price Chart

Chart prepared by James Stanley
The US Dollar nears the Q3 open as it hangs on to a big area of support on the chart. The 96.04 level is the 50% marker of the 2017-2018 major move, and just below that at 95.86 is the 50% marker of the long-term move, taking the 2001 top down to the 2008 low. As shown on the monthly chart below, this level has had some element of pull on price action since it came back into play in March of 2015.
US Dollar Monthly Chart

Chart prepared by James Stanley
Areas of Interest for USD-Weakness in Q3
If the US Dollar is going to pose a bigger breakdown in the second-half of this year, a natural next question is which markets might be best for such a scenario? And outside of risk assets like gold, there aren’t many currencies that carry significant appeal given the dovish stance across global central banks.
The Euro and the ECB are a great example here. The central bank isn’t anywhere near hawkish, nor does it appear that they’ll be there anytime soon. As a matter of fact, just earlier this month, Mario Draghi warned that the bank may need to look at further options for shoring up the European economy, but that warning seemed to matter little as USD-weakness outpaced that which showed up in the Euro, leading to a net move of strength so far this month. This alludes to the fact that the longer-term down-trend in EURUSD may remain to be oversold; and if the USD sell-off continues into Q3, EURUSD remains as an attractive venue for that theme.
At this point, EURUSD is holding higher-low support near fresh three-month-highs, and this takes place in a zone that I had looked at on Tuesday; taken from the April and early-June swing-highs, projected into current support. This keeps focus on resistance potential from the prior range that runs from 1.1448-1.1500.
EURUSD Daily Price Chart
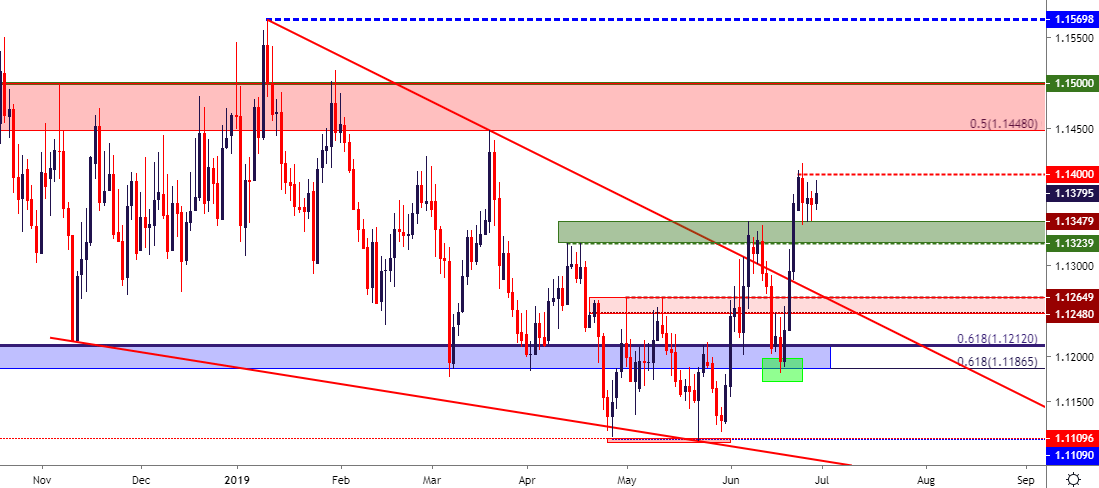
Chart prepared by James Stanley
USDJPY Reverses in Q2
One theme that did not come back to life with the return of the risk trade was the bullish backdrop in USDJPY. While the pair did a fairly respectable job of echoing risk themes in Q4 of last year as and Q1 of this year, Q2 saw that begin to diverge a bit.
USDJPY sold-off aggressively in Q4 but came back to life in Q1, mirroring what was taking place in US equities. Similarly, bears came back into play around early-May and drove for most of the month; but when the early-June flip around FOMC commentary came into play USDJPY continued to languish near the lows even though the risk trade was in full-bloom elsewhere.
I have been looking at the short-side of the pair throughout the month, continuing to use a Fibonacci retracement from the November 2017-March 2018 major move, and the 23.6% retracement of that major move has come in to help set the five-month-low. The ensuing bounce has seen prices trickle-up to an area of prior support, around the 108.00 handle, and this keeps the door open for short-side scenarios in the pair in the second-half of the year.
USDJPY Daily Price Chart
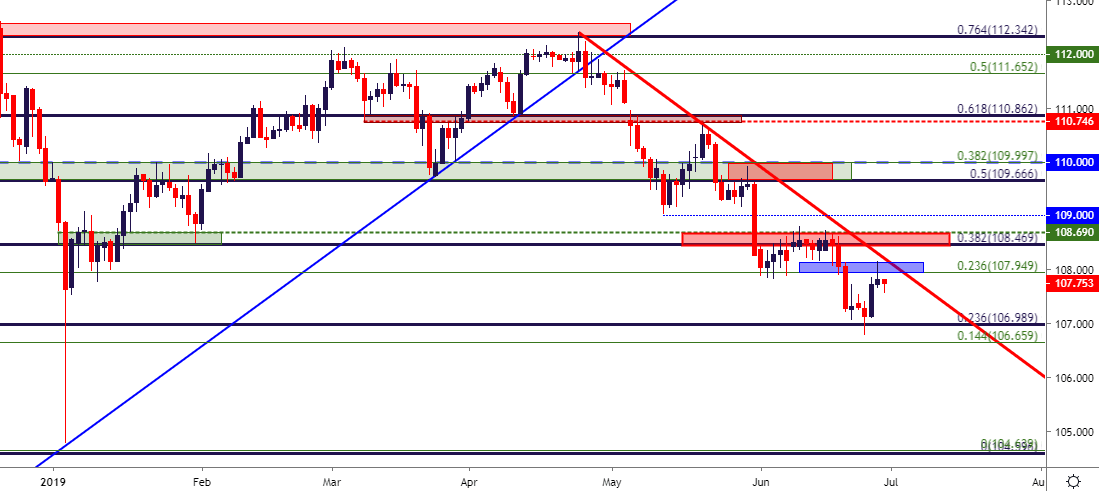
Chart prepared by James Stanley
To read more:
Are you looking for longer-term analysis on the U.S. Dollar? Our DailyFX Forecasts have a section for each major currency, and we also offer a plethora of resources on Gold or USD-pairs such as EUR/USD, GBP/USD, USD/JPY, AUD/USD. Traders can also stay up with near-term positioning via our IG Client Sentiment Indicator.
Forex Trading Resources
DailyFX offers an abundance of tools, indicators and resources to help traders. For those looking for trading ideas, our IG Client Sentiment shows the positioning of retail traders with actual live trades and positions. Our trading guides bring our DailyFX Quarterly Forecasts and our Top Trading Opportunities; and our real-time news feed has intra-day interactions from the DailyFX team. And if you’re looking for real-time analysis, our DailyFX Webinars offer numerous sessions each week in which you can see how and why we’re looking at what we’re looking at.
If you’re looking for educational information, our New to FX guide is there to help new(er) traders while our Traits of Successful Traders research is built to help sharpen the skill set by focusing on risk and trade management.
--- Written by James Stanley, Strategist for DailyFX.com
Contact and follow James on Twitter: @JStanleyFX


