


US Dollar Price Outlook Talking Points:
- The US Dollar is holding at an area of key support after last week’s aggressive sell-off.
- With USD price action holding at a big support level, the door could open for reversal setups in a couple of markets of interest. If, on the other hand, the bearish theme in USD continues, pairs like EURUSD or, perhaps even GBPUSD can be of interest.
- DailyFX Forecasts are published on a variety of currencies such as Gold, the US Dollar or the Euro and are available from the DailyFX Trading Guides page. If you’re looking to improve your trading approach, check out Traits of Successful Traders. And if you’re looking for an introductory primer to the Forex market, check out our New to FX Guide.
US Dollar Holds Key Confluent Support
It’s been a wild start to June across global markets, and with US equities making a strong topside push back towards the highs, the US Dollar is grasping at support on a key area of the chart. We looked into this area yesterday as the USD had intersected with the 200 Day Moving Average at a key Fibonacci level on Friday of last week. Thus far, that area around 96.50 has helped to hold the lows in the Greenback after an aggressive push from bears last week. The big question is whether this support can hold – and for FX traders there are a number of setups of interest for either scenario.
US Dollar Daily Price Chart: June Sell-Off Meets Key Confluent Support
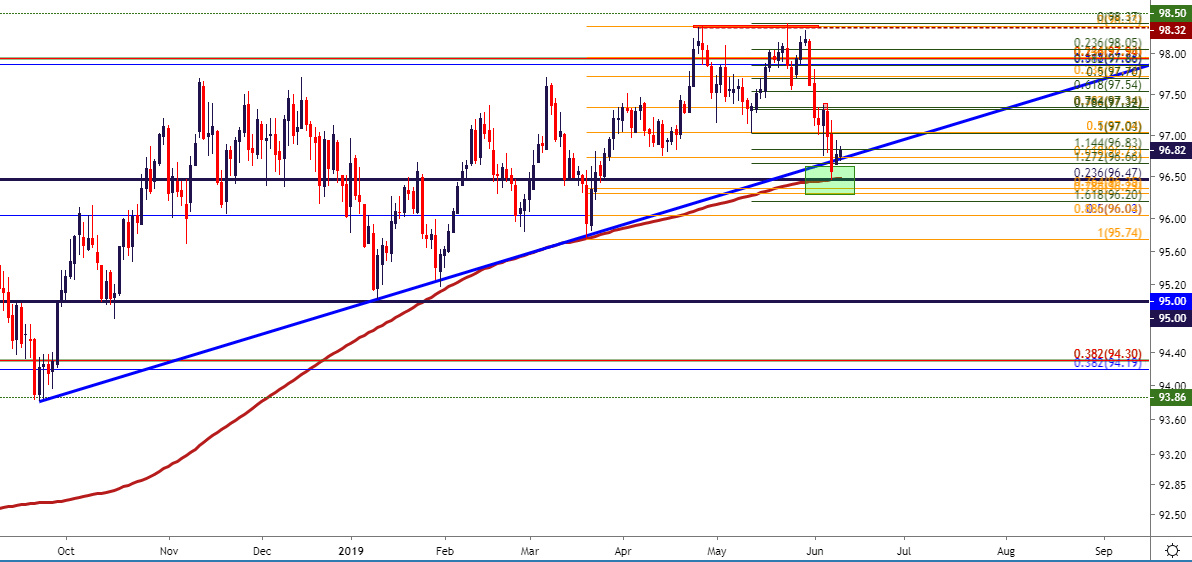
Chart prepared by James Stanley
EURUSD Presses Towards Two-Month-Highs
While the Euro isn’t likely a currency that many traders harbor long-term bullish biases around, on a near-term basis, matters may be a bit different. To be sure, there are a plethora of potential risks around the Euro-Zone, both political and economic in nature. But, these risks have been known for quite some time and for much of the last year, sellers have been in-control of price action in the single currency.
But what happens in a market when anyone who is willing to be and wants to be short already is? If there’s no one left to sell and only those holding short positions, at some point some of those shorts are going to want to close, which requires hitting the bid. And the simple act of prices moving higher could then encourage others to hit the bid, either to close existing shorts or to trigger fresh longs in a reversal strategy. This is where short squeezes come from, and this may be the scenario around the Euro at the moment.
In EURUSD, the down-trend was fairly clear through much of May. Prices appeared very reticent to test through the 1.1100 handle, however, and that bearish trepidation has given way to bullish short-term themes. As looked at in this week’s FX Setups, continued pullback in the US Dollar can allow for a larger retracement in EURUSD, perhaps to the prior zone of range resistance that runs from 1.1448-1.1500.
EURUSD Four-Hour Price Chart

Chart prepared by James Stanley
GBPUSD Tests Key Resistance, Prior Support
A similar albeit less pronounced theme has shown in GBPUSD, where sellers really made their mark last month. The pair was oversold for a large part of the period and similar to EURUSD, didn’t begin to bounce until the June open appeared.
In a contrast to the EURUSD setup above, the bounce thus far in GBPUSD has been milder. Prices remain around a key area on the chart that had previously functioned as support, taken from a batch of Fibonacci levels that runs from 1.2671-1.2721. If buyers are able to grab control over the next couple of days, which could be indicated by another short-term higher-high above the Friday swing at 1.2763, the door may soon open for topside strategies, looking for an eventual push towards the confluent zone around the 1.2900 handle.
GBPUSD Four-Hour Price Chart
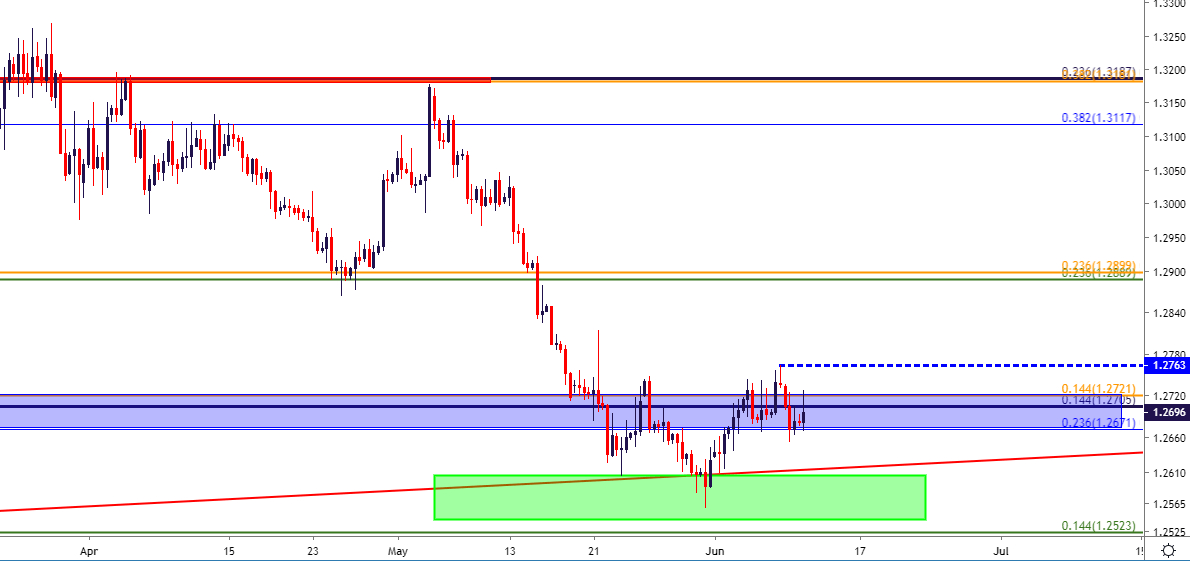
Chart prepared by James Stanley
AUDUSD Holds Key Resistance
On the long-side of the US Dollar, AUDUSD may retain some interest. I had looked at the pair in this week’s FX Setups as one of the more attractive backdrops for a return of USD strength, and the resistance zone investigated has thus far held the highs fairly well.
Current support is showing around a swing support area from last week in the .6950-.6960 area, but after a day of tests, support appears to be slipping. A push below opens the door for a re-test of the .6900 area after which a re-test of the five-month-low around .6860 becomes attractive.
AUDUSD Four-Hour Price Chart

Chart prepared by James Stanley
USDCAD Grasps for Support at Two-Month-Lows
Echoing that theme of USD-weakness last week was USDCAD, which put in a very pronounced downside move after having set a fresh high in the week prior. It was a stark change-of-pace for USDCAD price action, and this theme saw prices shed more than 300 pips as bears posed a direct-push down to a key support level, taking out a key trend-line in the process.
USDCAD Weekly Price Chart

Chart prepared by James Stanley
That support has since held after being tested throughout yesterday and again this morning. But buyers, at this point, have shown little ability to bring a topside push, as sellers came right back in after a 30-pip bounce yesterday. A break-below this key support level could open the door for a run down to the March lows, taken from around the Fibonacci level at 1.3132.
USDCAD Eight-Hour Price Chart

Chart prepared by James Stanley
To read more:
Are you looking for longer-term analysis on the U.S. Dollar? Our DailyFX Forecasts have a section for each major currency, and we also offer a plethora of resources on Gold or USD-pairs such as EUR/USD, GBP/USD, USD/JPY, AUD/USD. Traders can also stay up with near-term positioning via our IG Client Sentiment Indicator.
Forex Trading Resources
DailyFX offers an abundance of tools, indicators and resources to help traders. For those looking for trading ideas, our IG Client Sentiment shows the positioning of retail traders with actual live trades and positions. Our trading guides bring our DailyFX Quarterly Forecasts and our Top Trading Opportunities; and our real-time news feed has intra-day interactions from the DailyFX team. And if you’re looking for real-time analysis, our DailyFX Webinars offer numerous sessions each week in which you can see how and why we’re looking at what we’re looking at.
If you’re looking for educational information, our New to FX guide is there to help new(er) traders while our Traits of Successful Traders research is built to help sharpen the skill set by focusing on risk and trade management.
--- Written by James Stanley, Strategist for DailyFX.com
Contact and follow James on Twitter: @JStanleyFX


