


Gold Price Talking Points:
- Gold prices established a fresh 2019 low this week as sellers pushed through for a test below a key zone of support. But, that selling pressure began to slow as prices pushed below 1275, and ahead of this week’s close, prices pulled back, showing a wick below support for the weekly bar in Gold prices.
- The 1275.55 level is the 38.2% Fibonacci retracement of the August-February bullish move, and if buyers are able to hold support here in the open of next week’s trade, the door can remain open for topside strategies. But hope is not lost for sellers, as shorter-term themes can keep the door open for bearish continuation of this week’s sell-off, focusing in on resistance potential around prices of prior short-term support.
- DailyFX Forecasts are published on a variety of markets such as the US Dollar, Gold prices or the Euro and are available from the DailyFX Trading Guides page. If you’re looking to improve your trading approach, check out Traits of Successful Traders. And if you’re looking for an introductory primer to the Forex market, check out our New to FX Guide.
Do you want to see how retail traders are currently trading Gold prices? Check out our IG Client Sentiment Indicator.
Gold Prices Set Fresh 2019 Low Ahead of Good Friday, Easter Holiday
Many markets are currently closed in observance of Good Friday, and this can be a great opportunity to take a step back to evaluate some bigger pictures. And given Gold price action of recent, that’s a market deserving of some attention.
Gold prices set a fresh 2019 low this week, testing below a big zone of support that’s held up multiple bearish drives already this year. This zone of interest runs inside of two Fibonacci levels at 1275.55 and 1286.38, with a few items of interest in-between. The former of those prices is the 38.2% Fibonacci retracement of the August-February bullish move, while the latter is the 61.8% retracement of the 2013-2015 major move.
Gold prices worked in this zone shortly after the 2019 open as a bullish trend that began in August started to face turbulence. The first three weeks of January were marked by considerable grind in Gold prices, with buyers shying away from the 1300 level while bulls continued to cauterize support around 1275. But bulls soon won-out in late-January, and prices had extended all the way up to 1346 by mid-February.
Gold Price Eight-Hour Chart

Since that high in mid-February, matters haven’t really been the same. Price action quickly reverted back down to this big support zone, finding a bounce at the 1280.50 level in early-March. That lasted all the way until the 1320 level came into play, at which point sellers took another swing, quickly driving right back down to 1280.50. After yet another bounce, a descending triangle formation had started to build in Gold prices, taken from the descending trend-line to go along with horizontal support around the 1280.50 level. This is a formation that will often be approached in a bearish fashion, so as prices started to break-down earlier this week, it appeared as though that formation had started to fill-in.
Gold Price Four-Hour Chart

This week’s sell-off in Gold prices saw the establishment of a fresh 2019 low at 1270.70; but bears weren’t able to make much ground below this price, even as the US Dollar started a rather aggressive rally on Thursday, just ahead of the Good Friday holiday.
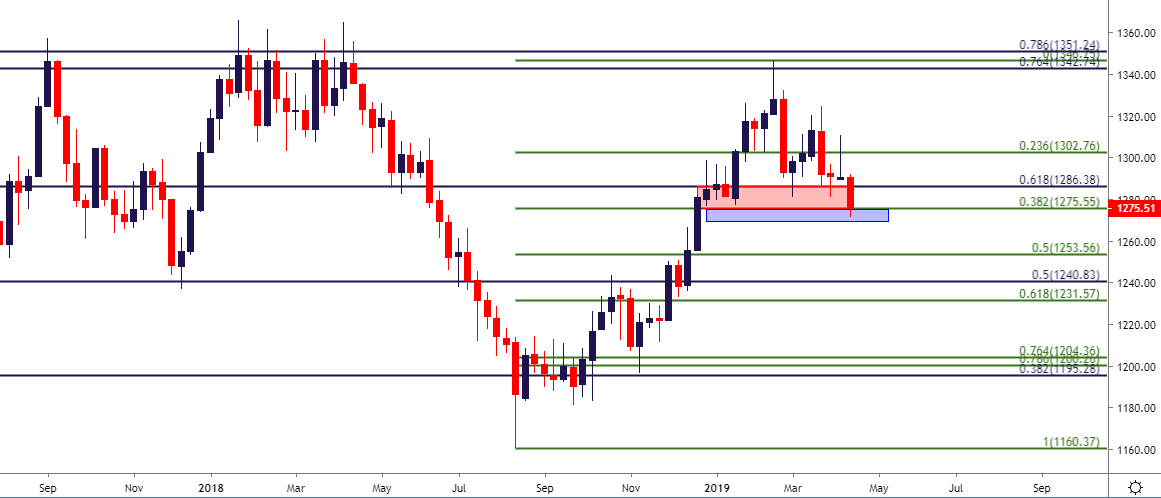
This begs the question as to whether or not sellers will be able to continue pushing Gold prices-lower, extending this fresh move; or whether there might be something else brewing on a longer-term basis. Taking a step back to the weekly chart highlights a wick from this week’s sell-off penetrating below the support zone. But the weekly close at 1275.51 also shows how buyers had pushed prices back-up to this key zone before the close of this week’s trade. This is something that can keep the long side of Gold prices as attractive, even given this week’s test below support.
Gold Weekly Price Chart
Gold Prices: The Bullish Scenario
The price of 1275.55 is the 38.2% retracement of the August-February bullish move; and if buyers are able to hold support around this level, the door can remain open for re-tests of the 23.6 and 14.4% retracements, showing at 1302.76 and 1319.91, respectively. Each of those are prices that have been used in recent strategy, looking for topside breakouts in March before bears began to dig-deeper into support. The level of 1302.76 is especially interesting for initial targets, as this price becomes confluent with the descending trend-line that makes up the resistance side of the triangle formation.
Gold Prices: The Bearish Scenario
Given this week’s establishment of a fresh low, combined with the pace of price action over the past month, and this is likely the side that’s going to get the interest of retail traders. But, this is a theme that traders should be very careful with, as the potential for a bear trap remains given the lack of continued selling-pressure once support was tested below.
But – this side was examined on Wednesday of this week as the break-down was beginning to take place. In that piece, I had looked at using prior areas of short-term support as areas-of-focus for resistance. Neither of those levels have come back into play yet, and for traders looking at taking on short-exposure in Gold, this can remain as a workable way of approaching the matter.
Such resistance potential exists inside of the longer-term, former support zone. The price of 1280.50 is prior support from the descending triangle, while 1286.38 is the 61.8% Fibonacci retracement of the 2013-2015 major move.
Gold Price Four-Hour Chart

Chart prepared by James Stanley
To read more:
Are you looking for longer-term analysis on the U.S. Dollar? Our DailyFX Forecasts for Q2 have a section for each major currency, and we also offer a plethora of resources on USD-pairs such as EUR/USD, GBP/USD, USD/JPY, AUD/USD. Traders can also stay up with near-term positioning via our IG Client Sentiment Indicator.
Forex Trading Resources
DailyFX offers an abundance of tools, indicators and resources to help traders. For those looking for trading ideas, our IG Client Sentiment shows the positioning of retail traders with actual live trades and positions. Our trading guides bring our DailyFX Quarterly Forecasts and our Top Trading Opportunities; and our real-time news feed has intra-day interactions from the DailyFX team. And if you’re looking for real-time analysis, our DailyFX Webinars offer numerous sessions each week in which you can see how and why we’re looking at what we’re looking at.
If you’re looking for educational information, our New to FX guide is there to help new(er) traders while our Traits of Successful Traders research is built to help sharpen the skill set by focusing on risk and trade management.
--- Written by James Stanley, Strategist for DailyFX.com
Contact and follow James on Twitter: @JStanleyFX


