


US Dollar, EURUSD, USDJPY, EURJPY Talking Points:
- It was a fairly mundane Q1 across the currency space despite a screaming start to the year, indicated by Yen-strength around the open that dissipated over the next few months. EURUSD has now been in a range-formation for the past five months.
- On the US Dollar side of the coin, USD remains in an ascending triangle formation that’s been building since last year. This will generally point to bullish breakout potential, and this week’s economic calendar is loaded with USD-items with high-impact data set to be released each day this week.
- DailyFX Forecasts are published on a variety of currencies such as the US Dollar or the Euro and are available from the DailyFX Trading Guides page. If you’re looking to improve your trading approach, check out Traits of Successful Traders. And if you’re looking for an introductory primer to the Forex market, check out our New to FX Guide.
Do you want to see how retail traders are currently trading the US Dollar? Check out our IG Client Sentiment Indicator.
US Dollar Holds Resistance at Mid-February Highs to Start Q2
The US Dollar has opened Q2 by holding at a key area of resistance, and this is the same zone of prices that held the highs in the currency in mid-February that runs from 97.21-97.30. The mid-February inflection saw prices sink down for a re-test of the 96.00 level, but that support held late in the month to allow for another topside advance in March. That’s when the yearly high at 97.71 came back into play and held a resistance inflection for the third time in the past five months.
US Dollar Four-Hour Price Chart

Chart prepared by James Stanley
The big question around the US Dollar as the door opens into Q2 is how motivated might bulls remain to be? Prices remain in a longer-term ascending triangle formation, the entirety of which was traversed by March price action: Following that resistance hit at the annual high, prices sold-off for the next week-and-a-half until support came-in off of the bullish trend-line. This showed-up shortly after the FOMC rate decision in March, and since then prices have been on a bee-line higher.
US Dollar Weekly Price Chart

Chart prepared by James Stanley
This Week’s Economic Calendar
In this first week of Q2, the economic calendar is loaded with USD-items, with high-impact US data set to be released Monday, Tuesday, Wednesday and Friday. The Non-Farm Payrolls report at the end of the week should be especially interesting following the dismal headline print that showed-up in March for February data. This was a key driver behind that resistance inflection at 97.70 last month, and that theme of USD-weakness lasted all the way into the FOMC rate decision.
Will that 20k print be revised higher? Will that trend continue with another dose of disappointment? Or, will jobs numbers recover, highlighting last month as a one-off in a streak of otherwise healthy employment prints?
DailyFX Economic Calendar: High-Impact for the Week of April 1, 2019
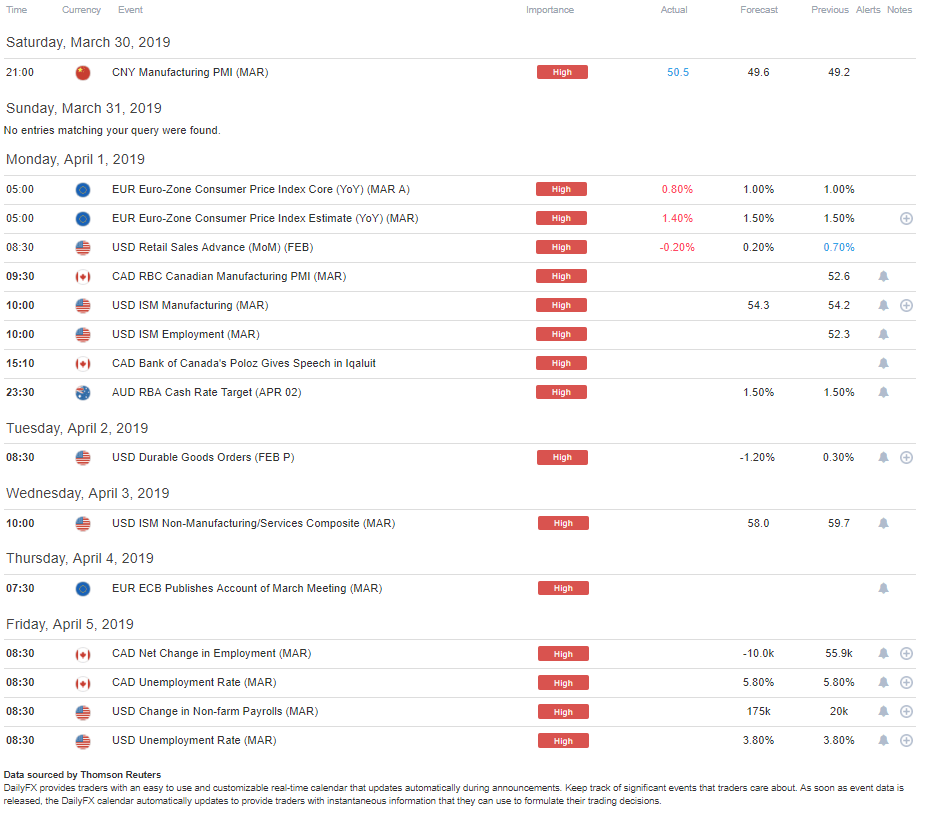
Chart prepared by James Stanley
EURUSD Holds Range Support as Q2 Begins
On the other side of the US Dollar’s strength, EURUSD weakness remains a potential theme as the door opens into Q2. Prices in the pair spent the bulk of Q1 trading inside of a range that had set-in during November and December. This technical impasse lasted through a variety of fundamental themes, including the announcement of stimulus exit at the ECB, a debt-stand off between Italy and Brussels and, last month, an announcement of a fresh round of stimulus.
EURUSD Daily Price Chart

Chart prepared by James Stanley
The big question for Q2 is whether bears might be able to garner bearish breakouts below this big zone of support. The price of 1.1212 is especially interesting, as this has been a key component of that support zone, especially of late, and this is the 61.8% Fibonacci retracement of the ‘lifetime move’ in EURUSD. That price helped to hold the Friday low and since, prices have been bouncing.
This week has already seen a bit of Euro data with a disappointing CPI print; but Thursday brings a far more interesting item with ECB minutes, taken from the meeting from which the bank triggered another round of TLTRO’s. The ECB had also cut growth and inflation forecasts at that meeting, so it doesn’t appear as though there was much for optimism. But – might this be the catalyst that bears need to tip prices-lower after more than five months of range-bound behavior?
EURUSD Four-Hour Price Chart

Chart prepared by James Stanley
USDJPY Continues Recovery After Late-March Spill
The final month of last quarter was marked by a re-appearance of risk aversion themes. US equities began to pullback after a really strong start to Q1, so strong in fact that it was the S&P 500’s strongest quarter in nearly a decade. But it was around the FOMC rate decision that risk aversion began to look a bit more opportunistic; and as stocks tipped-lower, so did USDJPY.
USDJPY had tracked that risk aversion theme fairly well in Q1: Q4 fear remained around the yearly open, but that theme was soon offset by USDJPY bulls, who then spent the next two and a half months building a very clean up-trend in the pair.
USDJPY Four-Hour Price Chart

Chart prepared by James Stanley
The post-FOMC sell-off drove prices in USDJPY down to a key area of support that runs from 109.67-110.00; and that zone has helped to hold the lows as themes of recovery built-in last week. Q2, however, has started off a bit differently. The pair gapped-up to a fresh weekly high and that has already been filled as prices tipped-back for a test of support in the area that held last week’s highs. That zone runs from 110.75-110.86, and this may keep the door open for short-term bullish continuation.
This remains a pair of interest for those looking for a continuation of the risk-on themes that ran so loudly during last quarter.
EURJPY for Risk Aversion
Similar to the above, EURJPY has tracked risk themes fairly well so far in 2019. The pair plummeted in the opening days of the year as risk aversion themes remained of interest following a brutal Q4. But, as stocks recovered, so did EURJPY. The pair broke-lower after the FOMC-fueled equity sell-off, finding a bit of support at the late-January swing-lows. The 125.00 area has continued to hold the highs similar to last week; and a hold here can keep the door open for risk aversion themes.
EURJPY Eight-Hour Price Chart

Chart prepared by James Stanley
To read more:
Are you looking for longer-term analysis on the U.S. Dollar? Our DailyFX Forecasts for Q4 have a section for each major currency, and we also offer a plethora of resources on USD-pairs such as EUR/USD, GBP/USD, USD/JPY, AUD/USD. Traders can also stay up with near-term positioning via our IG Client Sentiment Indicator.
Forex Trading Resources
DailyFX offers an abundance of tools, indicators and resources to help traders. For those looking for trading ideas, our IG Client Sentiment shows the positioning of retail traders with actual live trades and positions. Our trading guides bring our DailyFX Quarterly Forecasts and our Top Trading Opportunities; and our real-time news feed has intra-day interactions from the DailyFX team. And if you’re looking for real-time analysis, our DailyFX Webinars offer numerous sessions each week in which you can see how and why we’re looking at what we’re looking at.
If you’re looking for educational information, our New to FX guide is there to help new(er) traders while our Traits of Successful Traders research is built to help sharpen the skill set by focusing on risk and trade management.
--- Written by James Stanley, Strategist for DailyFX.com
Contact and follow James on Twitter: @JStanleyFX


