


NZDUSD, EURUSD, USDJPY Talking Points:
- Last night’s RBNZ rate decision finally saw the bank suggest a direction of the next rate move. After echoing a tone of ‘the next rate move could be up or down’ at previous rate decisions, the RBNZ last night implied that the next move might be a cut, and prices in the New Zealand Dollar dropped-quickly. In NZDUSD, an area of confluent resistance near the top of a symmetrical wedge formation held the highs, and NZDUSD prices promptly dropped below the .6820 area of Fibonacci support.
- Elsewhere in FX-land, ranges remain as the end of Q1 draws near. EURUSD continues to carry trend potential as sellers have driven deeper within the longer-term zone of support; with the low for this morning printing and holding around 1.1250. USDJPY remains in an interesting spot after last week’s flare of risk aversion, with buyers unable to push prices through the 110.75-110.86 zone.
- DailyFX Forecasts are published on a variety of currencies such as the US Dollar or the Euro and are available from the DailyFX Trading Guides page. If you’re looking to improve your trading approach, check out Traits of Successful Traders. And if you’re looking for an introductory primer to the Forex market, check out our New to FX Guide.
Do you want to see how retail traders are currently trading the US Dollar? Check out our IG Client Sentiment Indicator.
NZDUSD: Kiwi Crumbles after RBNZ
In one of the more interesting Central Bank themes, the RBNZ has continued to say that the next rate move could be ‘up or down.’ This isn’t exactly the type of forward guidance that market participants yearn for, as not only does it not say anything about the economy, it shows nothing from the opinions of its Central Bankers, making for a muddy backdrop in which investors have to project more than they’d probably like.
In response, the New Zealand Dollar has spent the past nine months in varying forms of congestion against its US counterpart; and the symmetrical wedge looked at in this week’s FX Setups and again in yesterday’s webinar highlighted that theme.
Yesterday’s RBNZ rate decision finally saw a bit of clarity on that front as the RBNZ implied that the next rate move could be a cut. In short order, NZDUSD fell from the resistance zone being followed, and prices jumped down to the first target around .6820.
NZDUSD Daily Price Chart
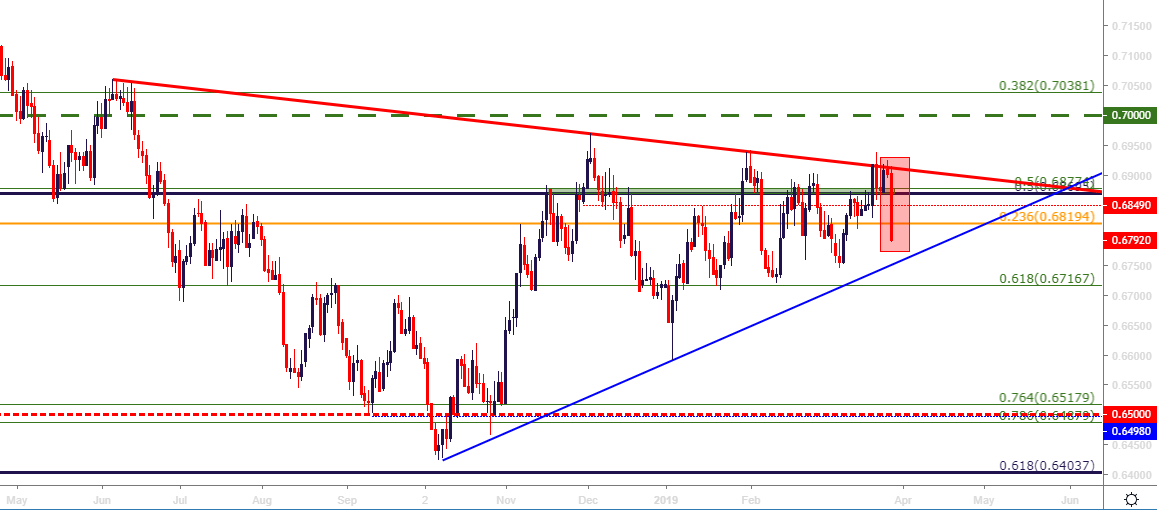
Chart prepared by James Stanley
The big question at this point is whether this move of weakness will turn into anything more, as the multi-month symmetrical wedge remains in order. Given the motive, the RBNZ taking a dovish turn towards forward-looking policy expectations, and this may be offset by continued dovishness at the Fed, making it a more difficult fundamental variable to rely upon for a break of this wedge and the establishment of a fresh trend.
EURUSD Tilts Down to 1250 as Draghi Warns of Downside Risks
Elsewhere in FX land, ranges with trend-potential continue to show as the end of Q1 nears. EURUSD pushed deeper within longer-term range support this morning after Mario Draghi reiterated the downside risks facing the European economy, similar to the ECB’s last rate decision earlier in the month. At that meeting, the ECB looked to head-off those risks by announcing another round of TLTRO’s, and this evoked a quick move of Euro-weakness as prices in EURUSD tested below a four-month old range.
But that weakness did not last: The US Dollar found resistance at yearly highs shortly after the announcement, and the Non-Farm Payrolls report the morning after brought EURUSD bulls back into the mix as the pair spent the next two weeks in some form of rally.
Until last week, that is, when EURUSD touched the bottom-side of a range resistance zone, at which point sellers pounced, and have largely been in-control ever since.
Might this be opening the door to fresh downtrends around the Q2 open? Or will the range continue to hold after more than five months of back-and-forth price action?
EURUSD Daily Price Chart
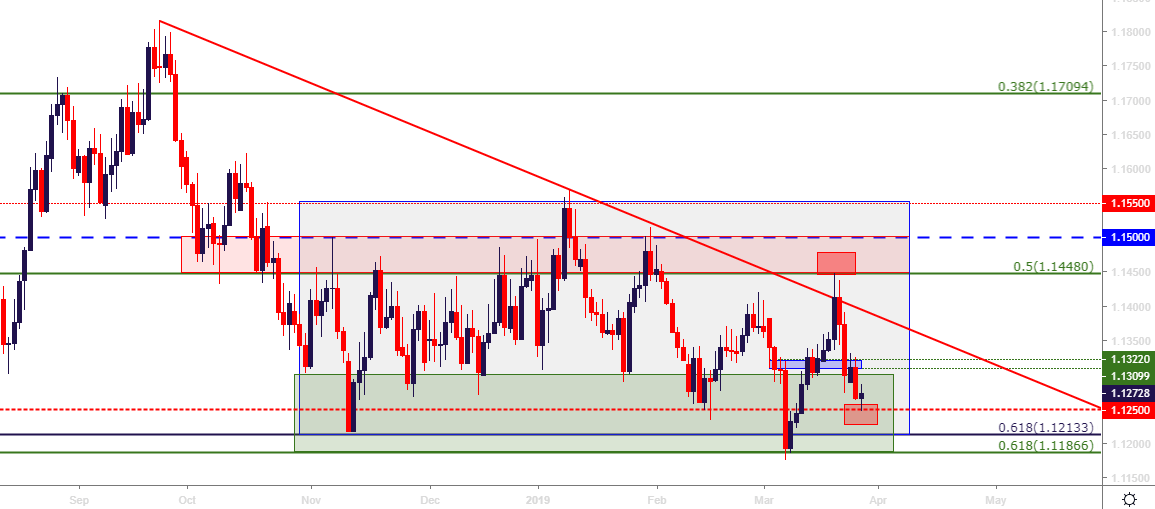
Chart prepared by James Stanley
USDJPY: Moments of Truth
The year started with a significant surge of Yen-strength. But that did not last for long, and the ensuing three months saw a generally weak Japanese Yen that allowed for a smooth and consistent bullish trend to develop in USDJPY.
That began to come into question last week around the FOMC rate decision, when a quick swell of risk aversion brought on Yen-strength. USDJPY dropped through a number of support regions, with buyers finally returning upon a re-test of the 109.67-110.00 zone of support. This was the same zone used to line-up bullish strategies in early-February, eventually allowing for the pair to re-test the 112.00 handle. That support has since held and prices have bounced; but buyers have been unable to yet test through the key area on the chart that runs from 110.75-110.86. A break-through here could re-open the door for bullish strategies; but if sellers are able to hold the highs below this key area on the chart, a deeper retracement or sell-off might be in the cards.
On the bullish side of the coin, and this is a very short-term observation – buyers have shown higher-low support around prior short-term resistance, taken from the 110.25 area. This can be setting up for a showdown in that 110.75-110.86 zone at some point later today.
USDJPY Four-Hour Price Chart

Chart prepared by James Stanley
To read more:
Are you looking for longer-term analysis on the U.S. Dollar? Our DailyFX Forecasts for Q4 have a section for each major currency, and we also offer a plethora of resources on USD-pairs such as EUR/USD, GBP/USD, USD/JPY, AUD/USD. Traders can also stay up with near-term positioning via our IG Client Sentiment Indicator.
Forex Trading Resources
DailyFX offers an abundance of tools, indicators and resources to help traders. For those looking for trading ideas, our IG Client Sentiment shows the positioning of retail traders with actual live trades and positions. Our trading guides bring our DailyFX Quarterly Forecasts and our Top Trading Opportunities; and our real-time news feed has intra-day interactions from the DailyFX team. And if you’re looking for real-time analysis, our DailyFX Webinars offer numerous sessions each week in which you can see how and why we’re looking at what we’re looking at.
If you’re looking for educational information, our New to FX guide is there to help new(er) traders while our Traits of Successful Traders research is built to help sharpen the skill set by focusing on risk and trade management.
--- Written by James Stanley, Strategist for DailyFX.com
Contact and follow James on Twitter: @JStanleyFX


