


Forex Talking Points:
- Next week brings a loaded economic calendar, offering both quality and quantity as a series of major Central Banks are scheduled for rate decisions ahead of the Friday releases of US and Canadian jobs numbers.
- The more interesting technical events as the weekly close nears is coming from Commodity markets like Oil and Gold. As looked at in yesterday’s webinar, a key area of Fibonacci resistance is helping to hold the highs in Oil, and this has had bearing on USDCAD. Meanwhile, Gold prices have continued to pullback from the prior February breakout, with price action now resting in a key zone of prior support.
- DailyFX Forecasts are published on a variety of currencies such as the US Dollar or the Euro and are available from the DailyFX Trading Guides page. If you’re looking to improve your trading approach, check out Traits of Successful Traders. And if you’re looking for an introductory primer to the Forex market, check out our New to FX Guide.
Do you want to see how retail traders are currently trading the US Dollar? Check out our IG Client Sentiment Indicator.
US Dollar Strength Re-Appears Ahead of Loaded Economic Calendar
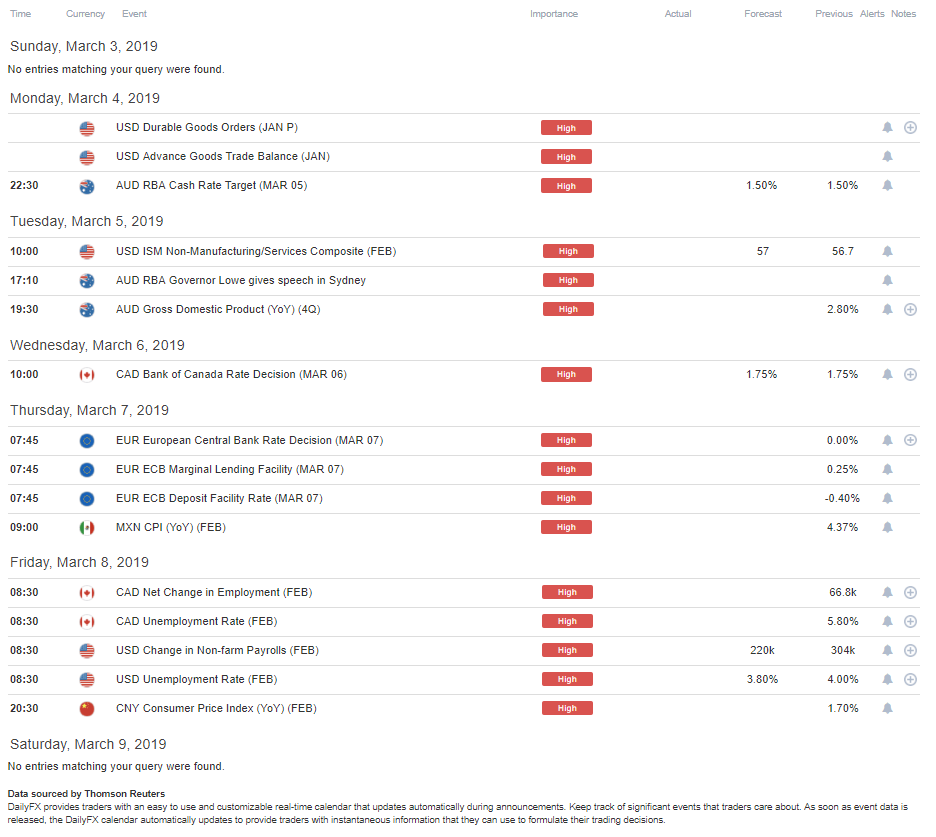
With the door now closed on February, the focus turns towards early-March data and next week is a big one. There are three major Central Bank rate decisions: The RBA announced on Monday night/Tuesday morning, the Bank of Canada on Wednesday morning and the European Central Bank hosts their rate decision the morning after. But also on the calendar are some key data prints, such as US and Canadian jobs numbers set to be released on Friday morning. All-in-all, next week’s calendar offers both quality and quantity of releases, with high-impact data set to be released each day Monday-Friday.
DailyFX Economic Calendar: High-Impact Events for the Week of March 4, 2019
US Dollar Recovers From Early-Week Losses
This week started off with a continuation of last week’s pullback in the US Dollar. Monday led into a precipitous drop on Tuesday; but support began to show around the Powell testimony to the House Financial Services Committee on Wednesday. And while that support helped to hold the lows, there wasn’t much of a bullish response until the Thursday release of US GDP data for Q4, which helped to push the US Dollar back above the 96.00 level on DXY, on the way to re-testing a prior area of support that runs from 96.27-96.30.
Buyers continued that topside push in the overnight session, and prices now look ready to re-test as resistance another prior support zone that runs from 96.47-96.53.
US Dollar Eight-Hour Price Chart

Yen Weakness is This Week’s Big Takeaway
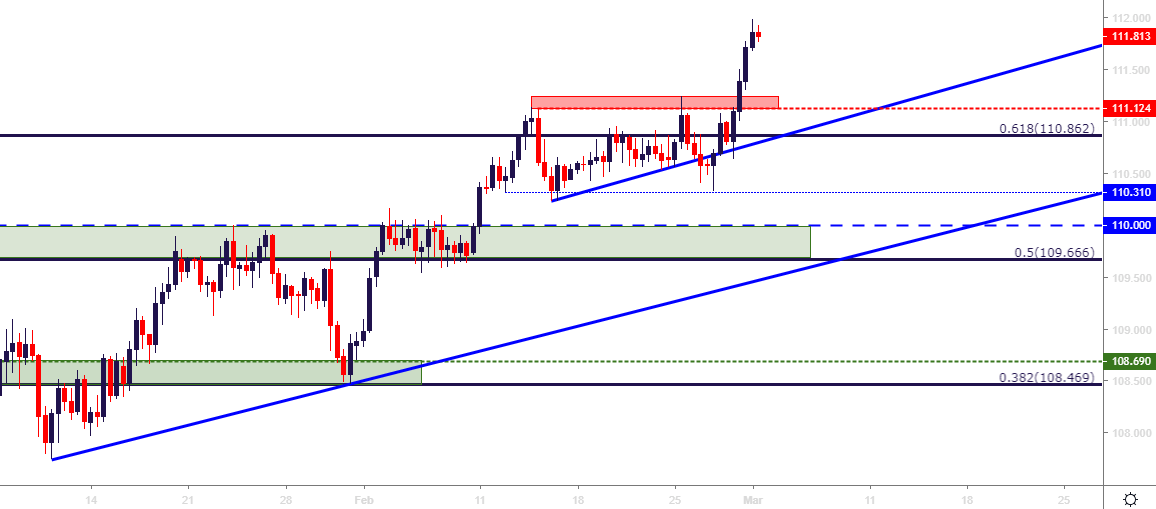
Despite the US Dollar’s struggles in the early-portion of this week, USDJPY has remained with a bullish backdrop throughout the period, posing a mere pullback to prior swing-support before pushing another bullish breakout to fresh 2019 highs.
This continues the pair’s bullish theme that’s been alive-and-well throughout the month of February, as an ascending triangle a few weeks ago led into a breakout to 111.00, and another similar scenario has led into a topside push up towards the 112-handle.
USDJPY Eight-Hour Price Chart
EURUSD Pushes Below Wedge – Prices Remain in Middle of Longer-Term Range
The longer-term range formation in EURUSD continues to hold. But, as looked at over the past couple of days, buyers have appeared very unmotivated upon tests or prior highs, leading into the build of a short-term rising wedge pattern. Such formations will often be approached with the aim of a bearish reversal, looking for the lack of enthusiasm from buyers upon tests of highs to, eventually, lead into a bearish move.
That’s started to show in EURUSD after prices fell below the support line of that wedge formation. A bit of a bounce has developed this morning, with short-term resistance showing off of that prior support trend-line; but this leaves the pair in an odd spot with price action stuck in the middle of the longer-term range.
EURUSD Four-Hour Price Chart

WTI Crude Responds to Fibonacci Resistance
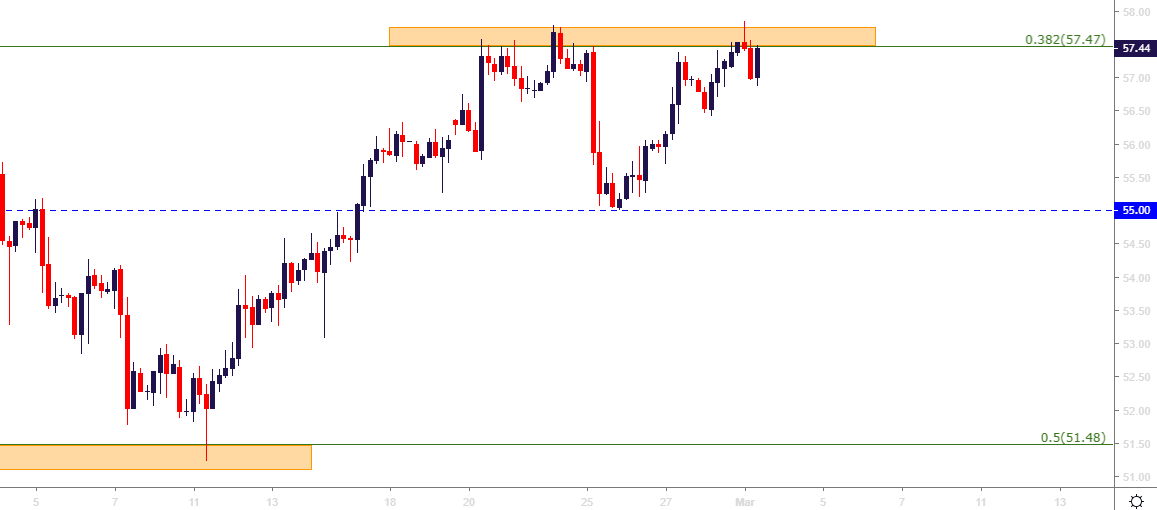
It’s been an interesting week in commodities and WTI Crude Oil just ran into a key area of resistance. I had looked at this during both Tuesday and Thursday webinars this week, as Oil prices had previously seen the bullish advance thwarted at a key area on the chart. The price of 57.47 is the 38.2% Fibonacci retracement of the 2016-2018 major move in Oil, and this level held resistance last week and into this week before prices finally retreated down to the 55.00 level. But, as looked at on Tuesday, a run back-up to 57.47 remained on the table, and that’s what’s taken place since then.
Similar to last week, this Fibonacci level has helped to stop the topside run dead in its tracks. A hold at this resistance can keep CAD-weakness strategies of interest in the near-term, particularly for traders looking at ways to add-in long-USD exposure in USDCAD.
WTI Crude Oil Four-Hour Price Chart: Revert to Resistance
Gold Prices Pullback to Key Support Zone: Can Bulls Stage a Stand?
The early-month breakout in Gold prices has been pulling back over the past week, and prices have moved back into a key zone of prior support: The big question at this point is whether it holds and whether buyers pose another gust of bullish price action. The $1302 area was tested for support on three separate occasions earlier in February. Each instance saw defense of support from buyers until, eventually, prices pushed up towards the $1350 handle. But – will March bring a similar scenario? Or will the pullback deepen down to fresh monthly lows?
Below the current support zone is another area of interest, running from the approximate $1275 up to $1286. This is the area on the chart that helped to cauterize support throughout January, and if prices do revisit down to this zone, topside strategies can remain as a potential theme.
Gold Eight-Hour Price Chart
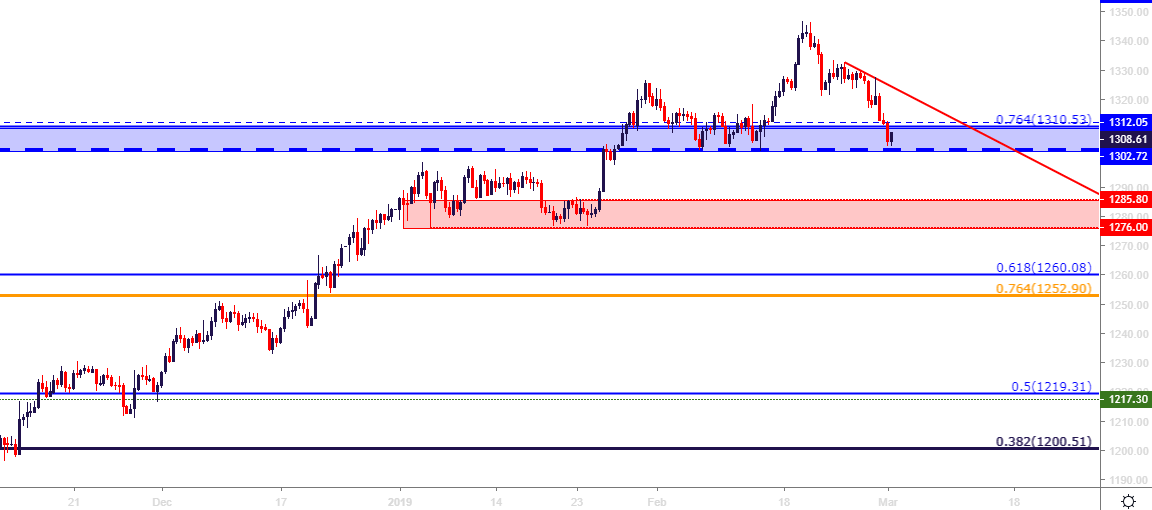
Chart prepared by James Stanley
To read more:
Are you looking for longer-term analysis on the U.S. Dollar? Our DailyFX Forecasts for Q4 have a section for each major currency, and we also offer a plethora of resources on USD-pairs such as EUR/USD, GBP/USD, USD/JPY, AUD/USD. Traders can also stay up with near-term positioning via our IG Client Sentiment Indicator.
Forex Trading Resources
DailyFX offers an abundance of tools, indicators and resources to help traders. For those looking for trading ideas, our IG Client Sentiment shows the positioning of retail traders with actual live trades and positions. Our trading guides bring our DailyFX Quarterly Forecasts and our Top Trading Opportunities; and our real-time news feed has intra-day interactions from the DailyFX team. And if you’re looking for real-time analysis, our DailyFX Webinars offer numerous sessions each week in which you can see how and why we’re looking at what we’re looking at.
If you’re looking for educational information, our New to FX guide is there to help new(er) traders while our Traits of Successful Traders research is built to help sharpen the skill set by focusing on risk and trade management.
--- Written by James Stanley, Strategist for DailyFX.com
Contact and follow James on Twitter: @JStanleyFX


