


EUR/USD, US Dollar Talking Points:
- This morning’s ECB rate decision saw the bank announce the end of QE purchases despite a backdrop of slowing growth and increased political strife in Europe. This has been long-expected since the earlier-year announcement of the bank’s intent. EUR/USD responded with a quick move of weakness shortly after the start of Mario Draghi’s accompanying press conference 45 minutes after the release of the statement.
- Next week’s economic calendar brings another key rate decision and this one has considerably more questions surrounding it. The Fed is widely expected to hike rates again, but market participants will be poring over the details of the bank’s forward-looking projections to build an estimate for how many hikes to expect next year. This morning’s unexpected drop in initial jobless claims reiterates strength in the jobs market; and yesterday’s CPI showed a solid 2.2% annualized inflation rate on both headline and core reads. But – global risks have been rising and this has taken a toll on emerging markets, creating a bit of turbulence in risk assets such as stocks.
- DailyFX Forecasts on a variety of currencies such as the US Dollar or the Euro are available from the DailyFX Trading Guides page. If you’re looking to improve your trading approach, check out Traits of Successful Traders. And if you’re looking for an introductory primer to the Forex market, check out our New to FX Guide.
Do you want to see how retail traders are currently trading the US Dollar? Check out our IG Client Sentiment Indicator.
EUR/USD Remains in Triangle Ahead of Draghi
It was July 24th of 2012 when Mario Draghi announced that the European Central Bank would do ‘whatever it takes’ to support the Euro. Now more than six years later, the bank is finally prepared to wind down a QE program that was initially expected to total around €1 Trillion but ended up costing €2.6 Trillion. This also comes at a difficult time for tighter policy in the bloc, as European growth is at its lowest level in four years; and the stalwart of the Euro-Zone, Germany, is contracting. This isn’t to mention the political volatility that’s been seen of late, with recent worries building around France after a nationalist bent started to show in countries like Italy and Spain.
In EUR/USD, the pair remains within the symmetrical triangle formation that’s been brewing for the past month-and-a-half. Resistance remains on the bearish trend-line connecting the October 22nd high to the November swing-high; and this comes after the support side of that formation helped to hold the lows yesterday.
EUR/USD Four-Hour Price Chart

Chart prepared by James Stanley
That formation takes place within two rather key zones on the chart. For resistance, the area that runs from 1.1448-1.1500 has been an active area throughout Q4, catching support in early-October and soon becoming resistance that held throughout November. On the underside of price action is a key Fibonacci level at 1.1212, which almost came into play in November before sellers pulled up just a few pips shy of an inflection.
EUR/USD Daily Price Chart
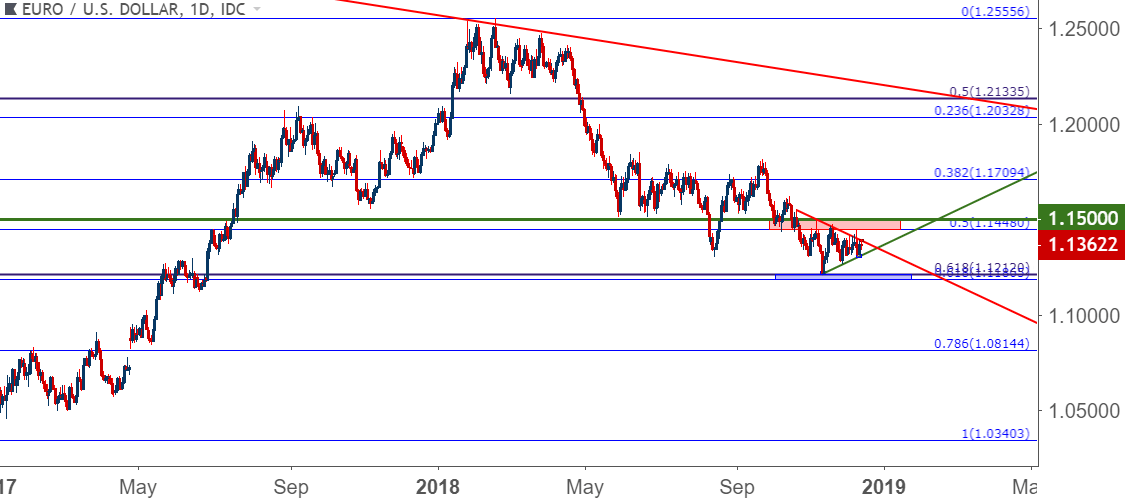
Chart prepared by James Stanley
GBP/USD Holding Resistance After May Survives No-Confidence Vote
Theresa May will continue to lead the UK through Brexit negotiations as the British PM survived yesterday’s vote of no-confidence. She had assured that she would not seek re-election, but given that she won in yesterday’s contest, she is afforded at least a year of safety per the rules of 1922.
The short-covering rally that pushed GBP/USD from the 1.2500-handle soon brought into play a key area of resistance on the chart at 1.2671. This is the 23.6% Fibonacci retracement of the ‘Brexit move’ and this is a level that had serviced as the yearly low in the pair from mid-August until the earlier-week break-down to fresh lows. This level helped to hold the highs yesterday and is showing more of the same so far for today.
GBP/USD Four-Hour Price Chart

Chart prepared by James Stanley
In yesterday’s article, I looked at additional resistance in the pair, as the rally from 1.2500 to 1.2671 came in rather vigorously. I pointed out an additional level around 1.2750, along with another at 1.2850 that could be looked to as an ‘invalidation level’ for stop placement. This can keep the bearish approach of interest in the near-term as yesterday’s vote has done nothing to decrease the probability of a Hard Brexit scenario. Theresa May still has the unenviable task of trying to negotiate a deal that will please both Europe and UK Parliament.
GBP/USD Two-Hour Price Chart
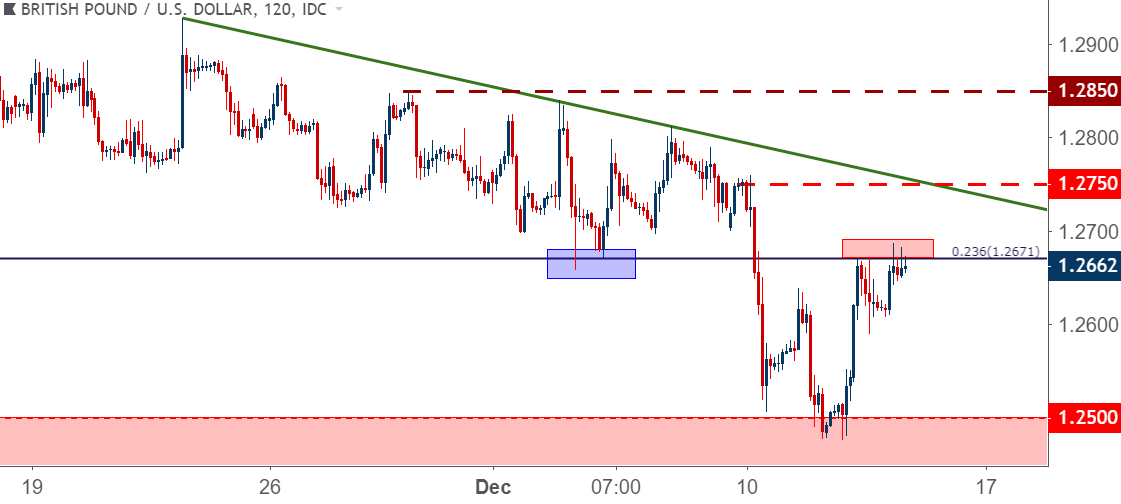
Chart prepared by James Stanley
US Dollar Consolidation Continues
Yesterday’s US CPI report came-in right at the expectation of 2.2% on both core and headline CPI reads, and this keeps the door open for a December rate hike from the FOMC at next week’s rate decision. The bigger question around the Fed, however, is 2019 and thereafter. Will the Fed talk up continued ‘gradual’ hikes? Or will we see the bank adopt more of a wait-and-see approach as a rising tide of global risk dictates caution with tighter policy?
We’ve seen hints on both sides of the equation from Fed speakers of recent, and this has taken a toll on US equities that have been mired by pessimism since opening the door into Q4; in stark contrast to the bullish breakouts that drove prices higher throughout Q3.
In the US Dollar, prices continue to display an element of consolidation after setting a fresh yearly high a month ago. Support has continued to show around the 96.47 Fibonacci level, which is the 23.6% retracement of the 2011-2017 major move. And resistance for this week has held around the late-November swing-high of 97.50.
US Dollar Eight-Hour Price Chart

Chart prepared by James Stanley
To read more:
Are you looking for longer-term analysis on the U.S. Dollar? Our DailyFX Forecasts for Q4 have a section for each major currency, and we also offer a plethora of resources on USD-pairs such as EUR/USD, GBP/USD, USD/JPY, AUD/USD. Traders can also stay up with near-term positioning via our IG Client Sentiment Indicator.
Forex Trading Resources
DailyFX offers a plethora of tools, indicators and resources to help traders. For those looking for trading ideas, our IG Client Sentiment shows the positioning of retail traders with actual live trades and positions. Our trading guides bring our DailyFX Quarterly Forecasts and our Top Trading Opportunities; and our real-time news feed has intra-day interactions from the DailyFX team. And if you’re looking for real-time analysis, our DailyFX Webinars offer numerous sessions each week in which you can see how and why we’re looking at what we’re looking at.
If you’re looking for educational information, our New to FX guide is there to help new(er) traders while our Traits of Successful Traders research is built to help sharpen the skill set by focusing on risk and trade management.
--- Written by James Stanley, Strategist for DailyFX.com
Contact and follow James on Twitter: @JStanleyFX


