


EUR/USD Caught in Congestion as USD Extends Fibonacci Support Bounce
EUR/USD, US Dollar Talking Points:
- The US Dollar has extended yesterday’s bounce from Fibonacci support. The level of 96.47 is the 23.6% retracement of the 2011-2017 major move in the currency, and this is the same price that had helped to set last week’s low. The big question at this point is whether bulls can continue to push to take out the two-week-high at 97.31; or whether we’re nearing a turn in the currency after the two-month bullish channel has started to give way over the past week.
- EUR/USD remains in a pattern of congestion, with sellers in the pair pushing prices right back into the symmetrical wedge pattern looked at yesterday. The latter-portion of this week’s economic calendar brings a couple of major items to the fray for the Euro, with Thursday’s ECB followed by a speech from ECB President, Mario Draghi on Friday.
- DailyFX Forecasts on a variety of currencies such as the US Dollar or the Euro are available from the DailyFX Trading Guides page. If you’re looking to improve your trading approach, check out Traits of Successful Traders. And if you’re looking for an introductory primer to the Forex market, check out our New to FX Guide.
Do you want to see how retail traders are currently trading the US Dollar? Check out our IG Client Sentiment Indicator.
US Dollar Extends Fibonacci Support Bounce
Yesterday saw a vigorous move priced-in to the US Dollar, as the currency opened the week by continuing last week’s sell-off, soon finding a bit of support at a key area on the chart at 96.47. This is the 23.6% Fibonacci retracement of the 2011-2017 major move in the currency, and this had come into play last week to help set the two-week low in USD.
Yesterday’s re-test of this level has led to a vigorous bounce in the US Dollar; and prices are pushing up towards fresh two-week highs around 97.31 on the chart.
US Dollar Hourly Price Chart: From Support to Resistance to Open the Week
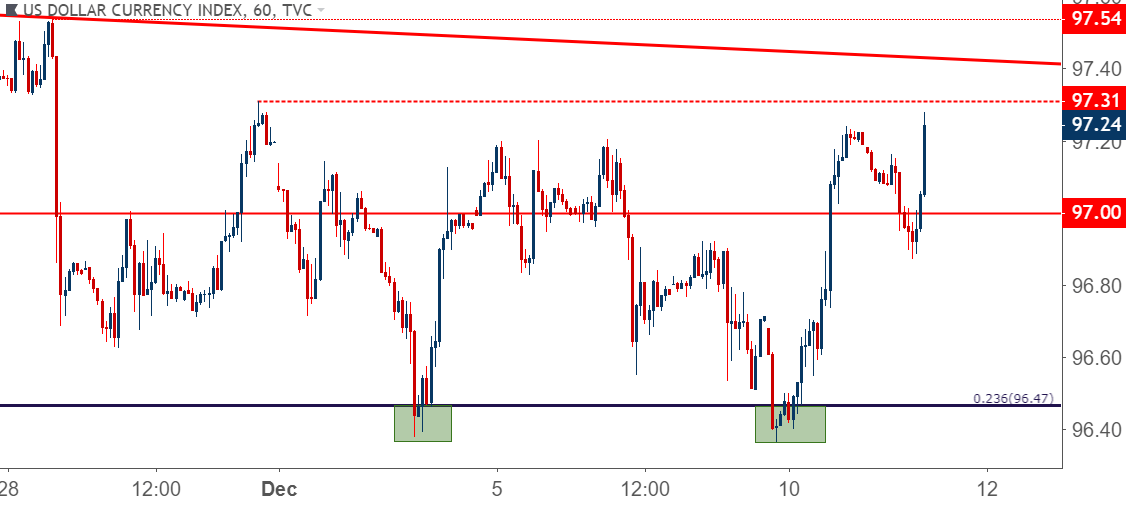
Chart prepared by James Stanley
At this point, there is a case on either side of the Greenback. On a shorter-term basis, that support response yesterday is notable as the US Dollar put in a visible and quick reaction. Prices even tip-toed above last week’s resistance zone before buyers lost motivation, and this may be indicating an increased tolerance for higher-prices that could, eventually, lead to fresh highs. The key for this coming to fruition will be buyers holding higher-low support and continuing to push-higher on the chart. That has so far taken place as this morning saw a higher-low support response around the 96.90 area on the chart.
US Dollar Two-Hour Price Chart
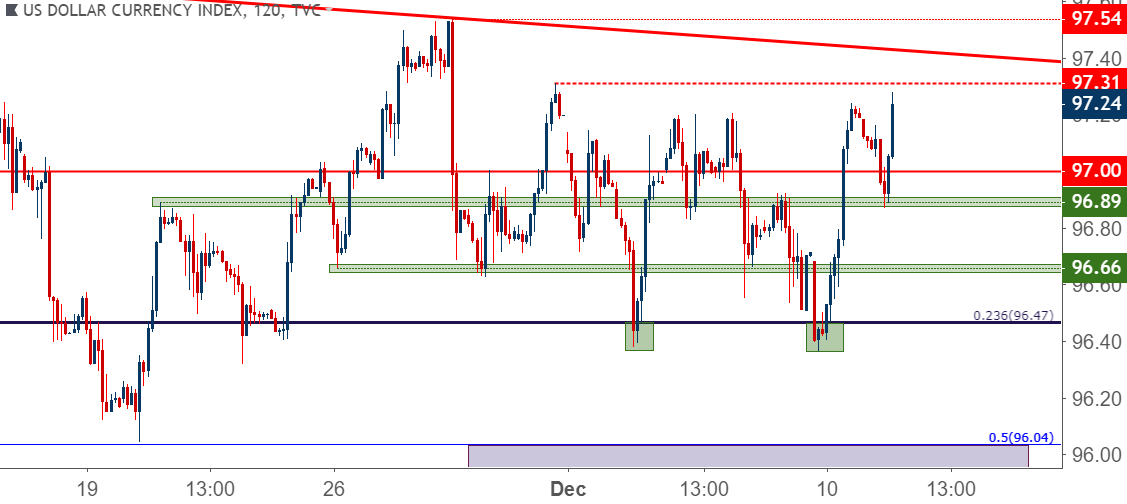
Chart prepared by James Stanley
On a longer-term basis, the big question is whether the US Dollar is close to or already has topped-out. The November high came-in around 97.70; and later in the month a lower-high came into play around 97.50. This was followed by a third-lower high in the closing days of November at 97.31, and this, when combined with the breach of the bottom-side of the bullish trend-channel that’s been in-play since the September FOMC meeting, can open the door to a deeper pullback or sell-off.
Key for that will likely be the FOMC rate decision next Wednesday that continues to carry high expectations for another 25 basis points of adjustment. The hike for next week is widely expected and it would probably be a far bigger surprise if a hike did not take place. But – the guidance offered at that meeting will offer a clue to market participants as to how aggressive the Fed might be in 2019.
US Dollar Eight-Hour Price Chart
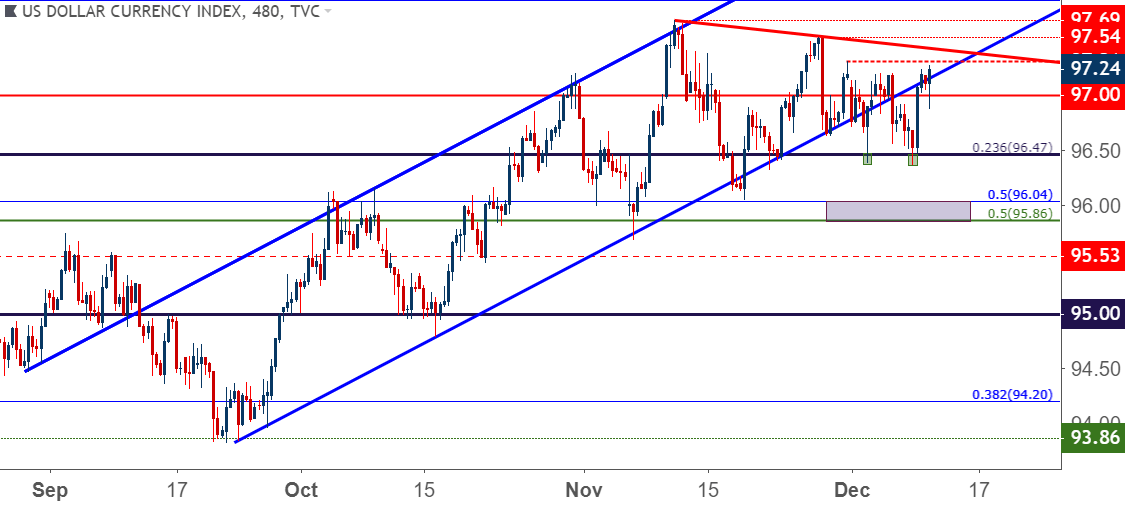
Chart prepared by James Stanley
EUR/USD Back Below 1.1400 as Congestion Continues
In yesterday’s piece, I looked at EUR/USD attempting to break its recent pattern of congestion. While there remains a plethora of drivers around the pair, from both Europe and the US, EUR/USD has spent the better part of the past month with range-like behavior. Sellers shied away from a support test at a key Fibonacci level of 1.1212 in mid-November, and since then a series of higher-lows have continued to price-in.
On the other side of price action, lower-highs had been building as we came-into this week, with yesterday providing a bit of excitement as prices temporarily pushed above the 1.1400 handle. But that excitement has settled as USD-strength came back into play, and prices are back to resisting on the underside of that prior bearish trend-line.
EUR/USD Four-Hour Price Chart
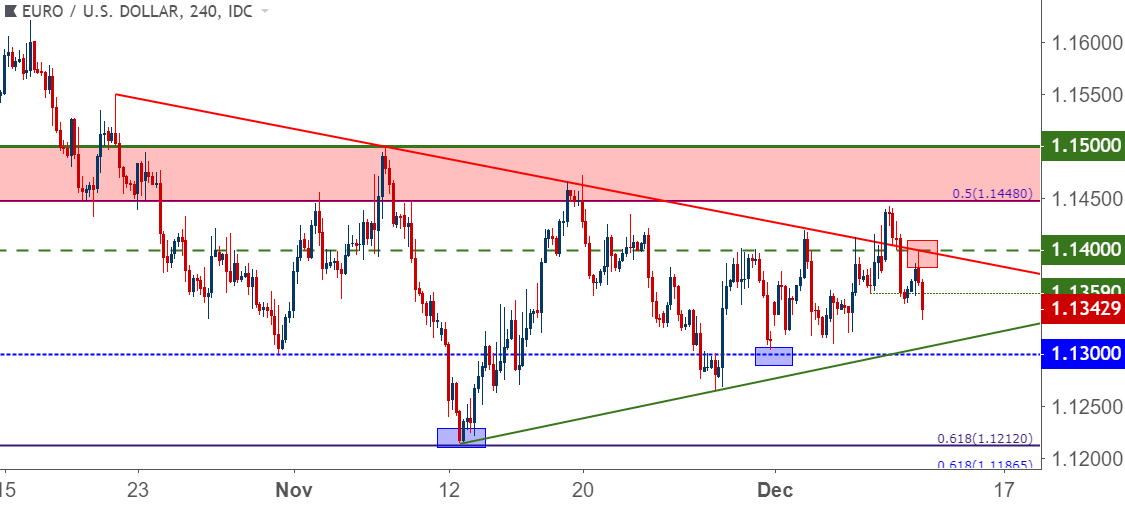
Chart prepared by James Stanley
GBP/USD Recovery Rally After Bounce Before1.2500
It was a rough start to the week for the British Pound as GBP/USD broke down to fresh 18-month lows after Theresa May cancelled this week’s Brexit vote. At this point, a brutal amount of uncertainty remains as nobody really knows what a final Brexit will look like; but as discussed in yesterday’s technical article on the pair, there wasn’t a very accommodative backdrop for continuing short-side approaches as prices were so far away from any nearby resistance points for stop placement.
The area on the chart that could be interesting for bearish strategies is getting nearer, and that resides at 1.2671, which is the 23.6% Fibonacci retracement of the ‘Brexit move’ in the pair. This level had helped to set the yearly low in August of this year; and it came back into play in the opening days of December, helping to cauterize the lows as Brexit pessimism drove a bearish trend in GBP.
That level was taken-out yesterday with a pronounced down-side breakout, and the big question now is whether it comes-in as resistance at prior support. This could keep the pair as one of the more interesting options for long-USD exposure, looking for a test of that 1.2500 level in GBP/USD.
GBP/USD Eight-Hour Price Chart
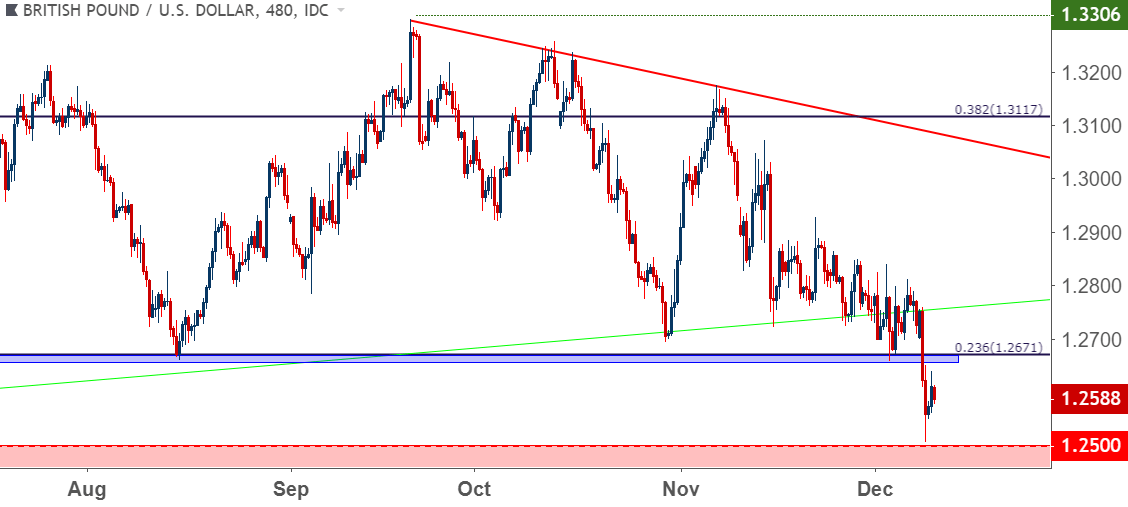
Chart prepared by James Stanley
NZD/USD Holds Higher-Low Support
On the short-side of the US Dollar, NZD/USD has been of interest over the past couple of months. October saw the pair build-in support even as the US Dollar was jumping up to fresh yearly highs, and since then prices in NZD/USD have continued to break-higher. Last week saw fresh five-month highs print in the pair, but buyers shied away before a re-test of the .7000 big figure.
So far this week, prices are putting in a support reaction around a big zone on the chart. I had looked at this area last week as there are two long-term Fibonacci levels within 8 pips of each other. Yesterday saw a doji print right around this area and so far today bulls are making a push on the chart. The big question here is whether buyers can pose a challenge of the .7000 big figure.
This can help to keep NZD/USD as one of the more attractive short-side USD options.
NZD/USD Daily Price Chart
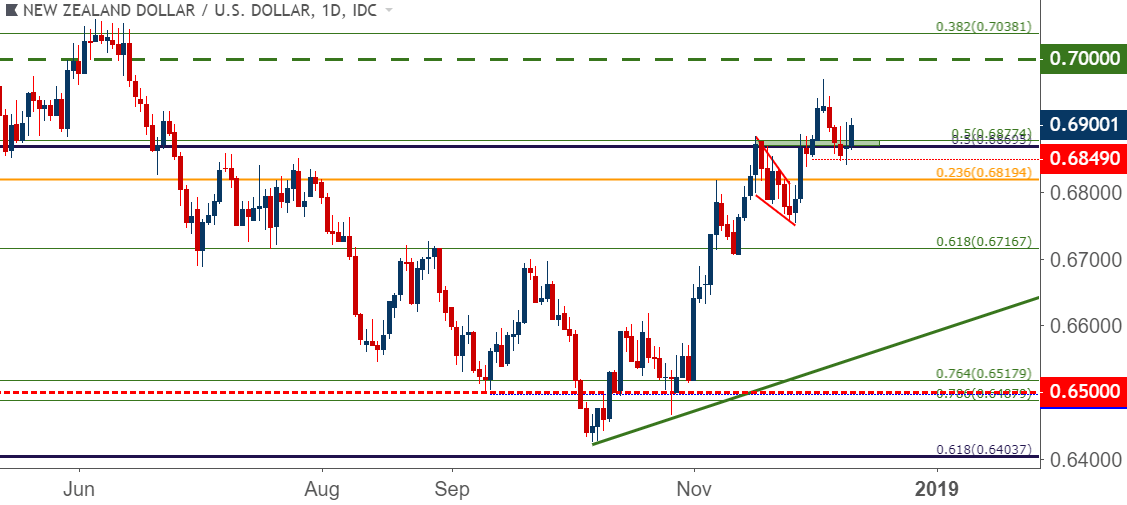
Chart prepared by James Stanley
To read more:
Are you looking for longer-term analysis on the U.S. Dollar? Our DailyFX Forecasts for Q4 have a section for each major currency, and we also offer a plethora of resources on USD-pairs such as EUR/USD, GBP/USD, USD/JPY, AUD/USD. Traders can also stay up with near-term positioning via our IG Client Sentiment Indicator.
Forex Trading Resources
DailyFX offers a plethora of tools, indicators and resources to help traders. For those looking for trading ideas, our IG Client Sentiment shows the positioning of retail traders with actual live trades and positions. Our trading guides bring our DailyFX Quarterly Forecasts and our Top Trading Opportunities; and our real-time news feed has intra-day interactions from the DailyFX team. And if you’re looking for real-time analysis, our DailyFX Webinars offer numerous sessions each week in which you can see how and why we’re looking at what we’re looking at.
If you’re looking for educational information, our New to FX guide is there to help new(er) traders while our Traits of Successful Traders research is built to help sharpen the skill set by focusing on risk and trade management.
--- Written by James Stanley, Strategist for DailyFX.com
Contact and follow James on Twitter: @JStanleyFX


