


US Dollar Talking Points:
- It was another strong showing in US GDP, as this morning’s release showed a beat of the expectation as Q3 growth came in at 3.5% versus the expectation of 3.3%. The US Dollar has pulled back from the highs around that release, indicating that the move was more than priced-in ahead of 8:30. Given the Dollar’s strong topside breakout throughout this week, the big question is whether bulls show-up at higher-low support ahead of this week’s close, as we approach a really big week of data on next week’s economic calendar.
- Both EUR/USD and GBP/USD have been pushing down to fresh-lows as headline risk has engulfed both the Euro-Zone and the UK. In the Euro-Zone, concern continues around the potential stand-off between Brussels and Rome, and this week saw the unprecedented move of the European Commission rejecting the Italian budget. In the UK, Theresa May survived the 1922 Committee, for now, but it still appears as though any breakthroughs on the Brexit-front are not yet near. Next week brings the Bank of England, and the BoE has been very dovish and concerned around Brexit ever since the referendum, so it can be difficult to imagine a backdrop with which they’re not dovish given the series of risks sitting ahead.
- DailyFX Forecasts on a variety of currencies such as the US Dollar or the Euro are available from the DailyFX Trading Guides page. If you’re looking to improve your trading approach, check out Traits of Successful Traders. And if you’re looking for an introductory primer to the Forex market, check out our New to FX Guide.
Do you want to see how retail traders are currently trading the US Dollar? Check out our IG Client Sentiment Indicator.
US Dollar Breakout Pulls Back Ahead of 2018 High
The US Dollar has continued its ascent and hard-charging at the 2018 high around the 97.00 handle on DXY. This extends what’s become an aggressive up-trend over the past week-and-a-half, following last Tuesday’s test below support at 95.00. Along the way, the Greenback has pushed through a number of key resistance levels, including the 96.04 that held the highs on four separate occasions earlier in the month, and then 96.47 which is the 23.6% Fibonacci retracement of the 2011-2017 major move.
US Dollar Four-Hour Price Chart: Strong Two-Week Trend as USD Nears 2018 High

Chart prepared by James Stanley
Next week’s economic calendar is loaded with high-impact events, and US corporates continue reporting Q3 earnings with Apple waiting in the wings for their earnings announcement. That takes place next Thursday after market close, with Non-Farm Payrolls set to be released before the following US open. On the Central Bank side, the BoJ hosts an interest rate decision on Tuesday evening/Wednesday morning, and the Bank of England follows that with a Super Thursday announcement on Thursday morning. This is when the bank will provide updated projections to accompany the press conference to announce the decision. The wide expectation is for no changes to rates given the continuing saga around Brexit negotiations.
DailyFX Economic Calendar: High-Impact for the Week of October 26, 2018
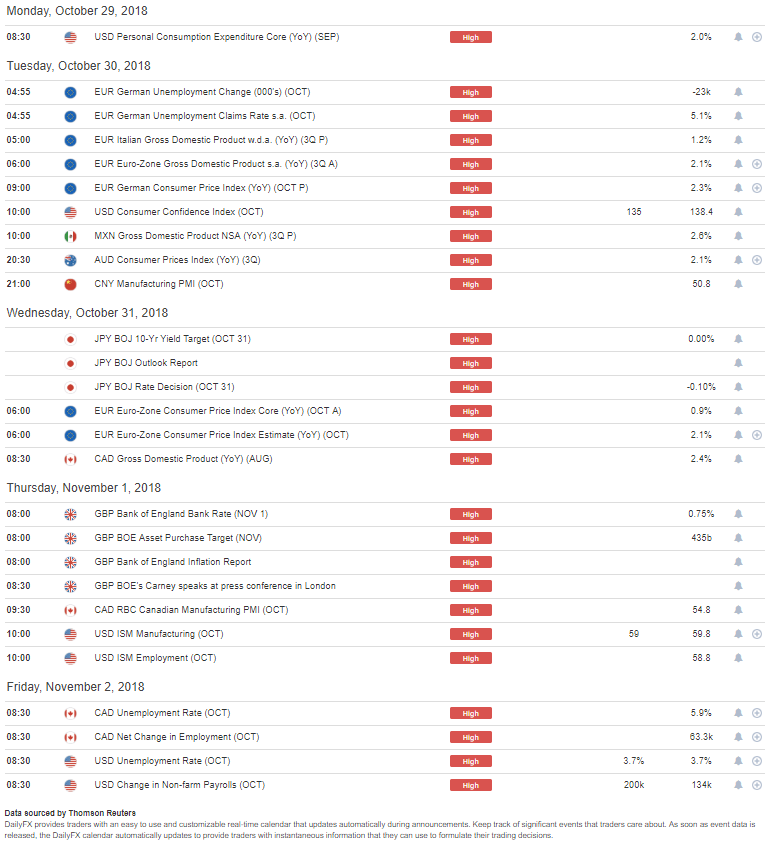
Chart prepared by James Stanley
US Dollar: Too Hot to Handle, Too Strong to Ignore?
The US Dollar’s topside run has been fairly pronounced over the past week-and-a-half, and this produces a challenge for strategies of continuation given that we’re fast nearing the 2018 high. Since DXY broke-out from the 96.04 level two days ago, pullbacks have been shallow and bulls have remained active; creating a trend reminiscent of the risk-aversion led drives from April/May and then again in early-August.
The big question is if and for how long this might continue, and the product of that problem will likely be determined by continued risk aversion in the Euro and the British Pound, as large issues are surrounding each economy at the moment.
For USD bulls, at this point, the attractive way forward appears to be either waiting for a pullback to support at prior resistance, and given the Greenback’s topside run, there are a couple of areas of interest for such a strategy. Or, alternatively, looking for topside breakouts beyond the 97.00 level that had previously marked the August top and currently constitutes the one-year high in the currency.
US Dollar Two-Hour Price Chart

Chart prepared by James Stanley
EUR/USD Sinks Towards Support Following ECB
This week brought an ECB rate decision and on the same day EUR/USD perched down to fresh near-term-lows. With hindsight, or on longer-term charts, it would be easy to associate this continuation of selling with that meeting from yesterday, but looking within the move it would appear as though this is something different. The bulk of yesterday’s selling in the Euro happened after Mario Draghi had left the stage, and in EUR/USD, this came after a resistance test at a prior area of swing support at 1.1430. Since then, bears have been in-chart, pushing down towards 2018 lows around the 1.1300 handle.
EUR/USD Four-Hour Price Chart
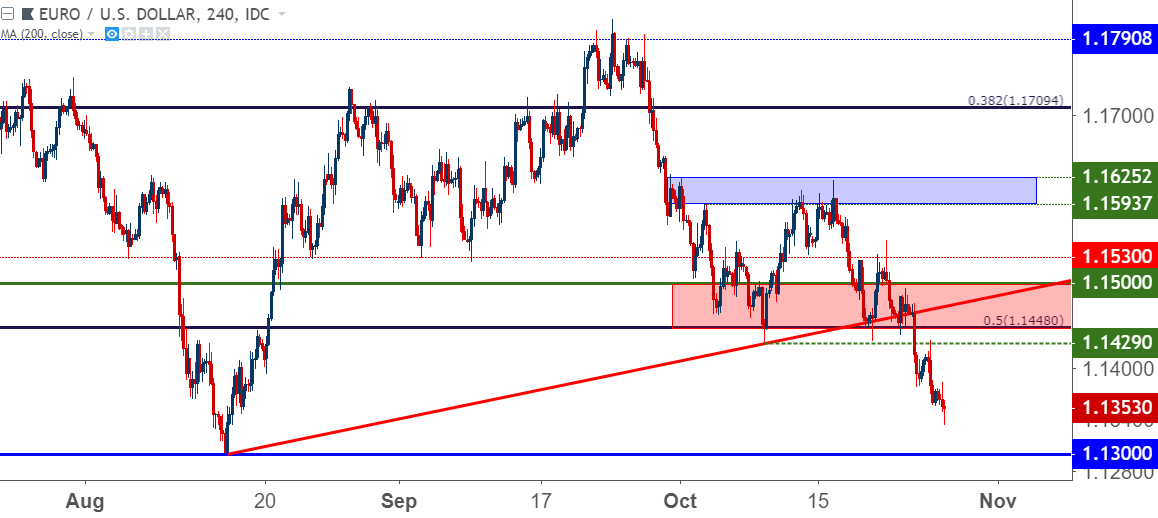
Chart prepared by James Stanley
GBP/USD: Brutal Week for the British Pound, Support at the September Low
Also contributing to that run of US Dollar strength has been a continued sell-off in the British Pound that’s remained active throughout the week. Last week saw prices close above the key level around 1.3000 while holding trend-line support. But this week’s open was not so kind, and prices quickly broke out of the symmetrical wedge pattern that’s been building in the pair, and at that point I looked at bearish continuation potential provided by check-back to resistance at prior support. That filled-in on Tuesday and since then, it’s been a fairly vigorous move lower as the pair has perched back-down to the September swing-low.
GBP/USD Four-Hour Price Chart: Wedge Break, Resistance Check, Fresh Lows

Chart prepared by James Stanley
Risk Aversion Continues to Show
So far Q4 has been rough on the risk trade. Equities are continuing to show weakness, the Dollar has found considerable strength on a risk-aversion driven bid, and the Japanese Yen has sprung back into action as strength has shown across a variety of JPY pairs.
Coming into this week, I had looked at bearish breakouts in GBP/JPY to work with that theme, and this soon filled in as the pair pushed down to monthly lows. The pair is now oversold by a number of metrics, and this opens the possibility of waiting out a retracement in order to find lower-high resistance, at which point bearish continuation strategies could become attractive again. Below, two potential levels of interest are highlighted on the four-hour chart of GBP/JPY for such a purpose.
GBP/JPY Four-Hour Price Chart

Chart prepared by James Stanley
Rough Week for the Dow – DJIA Digs into to 78.6% Fibonacci Support
This week saw another extension of the selling that’s taken place in US stocks as both the Dow and S&P moved down to fresh lows. But, the past couple of days have produced support around the 78.6% Fibonacci retracement in the Dow Jones Industrial Average. If this can hold through this morning’s early trade, the door could be opened for a bullish backdrop as the close nears, largely on the basis of profit taking from short-side approaches this week. If prices do break-down below this support, there’s one more area of interest below, taken from the 88.6% Fibonacci retracement of last quarter’s bullish move in the index.
Dow Daily Price Chart: Below 200 DMA, Attempted Support Build at 78.6% of Q3 Move
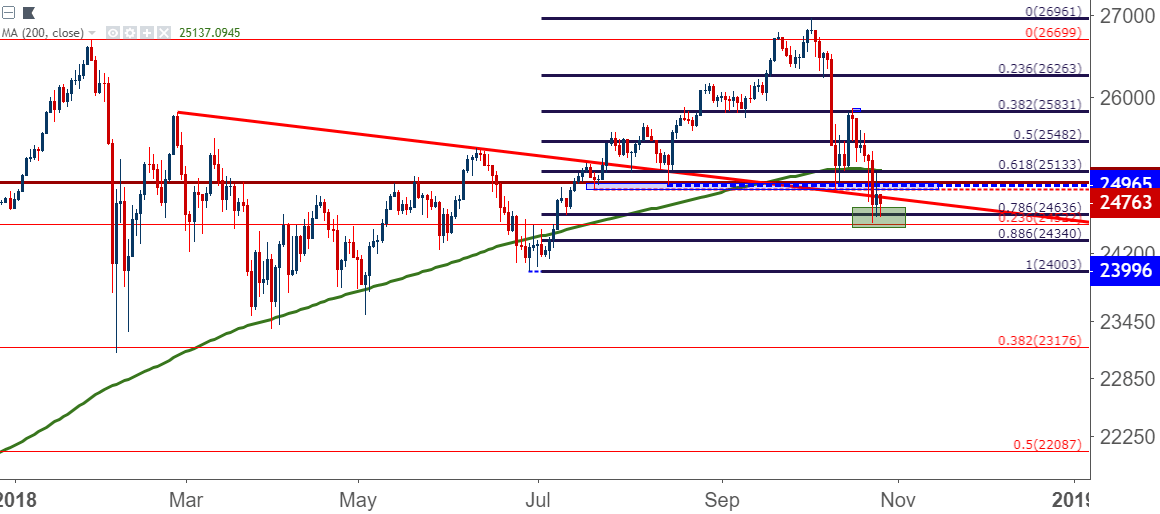
Chart prepared by James Stanley
To read more:
Are you looking for longer-term analysis on the U.S. Dollar? Our DailyFX Forecasts for Q4 have a section for each major currency, and we also offer a plethora of resources on USD-pairs such as EUR/USD, GBP/USD, USD/JPY, AUD/USD. Traders can also stay up with near-term positioning via our IG Client Sentiment Indicator.
Forex Trading Resources
DailyFX offers a plethora of tools, indicators and resources to help traders. For those looking for trading ideas, our IG Client Sentiment shows the positioning of retail traders with actual live trades and positions. Our trading guides bring our DailyFX Quarterly Forecasts and our Top Trading Opportunities; and our real-time news feed has intra-day interactions from the DailyFX team. And if you’re looking for real-time analysis, our DailyFX Webinars offer numerous sessions each week in which you can see how and why we’re looking at what we’re looking at.
If you’re looking for educational information, our New to FX guide is there to help new(er) traders while our Traits of Successful Traders research is built to help sharpen the skill set by focusing on risk and trade management.
--- Written by James Stanley, Strategist for DailyFX.com
Contact and follow James on Twitter: @JStanleyFX


