


US Dollar Talking Points:
- The US Dollar continues to hang near resistance at 96.04 after another earlier-morning test of this level, amounting to the fourth such instance already in October. This resistance comes from the 50% marker of the 2017-2018 bearish move in the currency, and this has proven a stubborn area for buyers. While this resistance test has been taking place, another interesting theme has re-appeared and that’s a revival of risk aversion in equities.
- Caterpillar shares are trading lower despite beating both top and bottom lines earlier today; but given the warnings from the company about rising material costs, coupled with 3M cutting forward-looking forecasts, investors are becoming more concerned with the dual threats in the US economy of both rising tariffs and rising interest rates. Meanwhile, matters across the Atlantic remain worrisome, as the potential for a stand-off between Brussels and Rome remains over the Italian budget, and markets may be soon seeing a no-confidence vote around British PM, Theresa May.
- DailyFX Forecasts on a variety of currencies such as the US Dollar or the Euro are available from the DailyFX Trading Guides page. If you’re looking to improve your trading approach, check out Traits of Successful Traders. And if you’re looking for an introductory primer to the Forex market, check out our New to FX Guide.
Do you want to see how retail traders are currently trading the US Dollar? Check out our IG Client Sentiment Indicator.
US Equities Re-Test Lows in the Dow and S&P
Sellers have come back into the equity space, and ahead of the US open, both the Dow Jones and the S&P 500 are re-testing the October lows that were set a couple of weeks ago.
Dow Jones Daily Price Chart: Testing Below Trend-Line, Fibonacci Support

Chart prepared by James Stanley
Wall of Worry
This morning’s moves are being driven, at least in-part, by earnings announcements at the industrial bellwether of Caterpillar along with 3M. Caterpillar cited rising material costs despite their earnings beat (both top and bottom), while 3M cut forward-looking forecasts. This speaks to the growing fear that the US economy may have already peaked, and given the dueling forces of rising tariffs and rising interest rates, US companies may have a tougher road ahead.
Outside of the US – the horizon grows a bit more dim as there are challenges in both Europe and the UK that are set to remain in the spotlight this week.
In Europe, the standoff between the European Commission and Italy continues and neither side has yet shown a willingness to give. Italy wants a wider budget deficit so that they can fund growth-based initiatives while Brussels wants to impose an element of austerity. So far, Italy has appeared resistant to modifying that budget, and this may lead to the EC sending that budget back to Italy to be re-drafted in order to meet the Commission’s budget requirements for Debt-to-GDP ratios.
In the UK, Brexit remains messy, and that plot may thicken this week as Prime Minister Theresa May could be facing a no-confidence vote. As Brexit day grows near, markets still have very little idea for what could be expected after the split actually takes place. And at this point, markets may not even know who will be running the country when this takes place.
Collectively, this has amounted to a similar dose of risk aversion as what was seen earlier in the month. Stocks are showing this most visibly, but there are strains of that condition showing in FX as well, as both the US Dollar and Japanese Yen have been bid on risk aversion flows. The US Dollar continues to trade near the 96.04 resistance level, which is the 50% marker of the 2017-2018 bearish move in the currency. This level has now shown as resistance four separate times in October, and given the persistent response that was seen after yesterday’s test, it appears as though a topside break may soon be in the cards.
US Dollar Four-Hour Price Chart: Persistent Resistance at 96.04

Chart prepared by James Stanley
If prices do break-higher in the US Dollar, the level of 96.47 is the next area of interest. This is the 23.6% retracement of the 2011-2017 major move, and this is the same Fibonacci study from which the February low came-in at the 50% marker.
US Dollar Daily Price Chart: 96.47 Next Level of Interest in DXY

Chart prepared by James Stanley
EUR/USD Continues in Stubborn Support Zone
Despite the risk aversion showing around global equities this morning, with the DAX pushing down to fresh 18-month lows, EUR/USD continues to sputter around what’s become a stubborn area of support. This was a focus chart in last Thursday’s webinar in which I shared that this has tendencies of a bear trap. That’s largely remained as the pair continues with bearish structure but, at this point, sellers have been unable to make fresh ground as the past two weeks have brought upon higher-lows upon tests of support.
EUR/USD Eight-Hour Price Chart: Mired in Stubborn Support Zone

Chart prepared by James Stanley
GBP/USD Bounces, Resistance Potential at Prior Support
Worries continue to build around Brexit as there is now even more uncertainty in the situation. This fear pushed the pair below a big support level to start this week at 1.3000, and price action eventually caught support around the 88.6% retracement of the prior October move. That support has led into a bounce, and a bit of resistance has started to show off of an area of prior support, which keeps the door open for short-side approaches in GBP/USD.
GBP/USD Four-Hour Price Chart: Resistance Potential at Prior Support
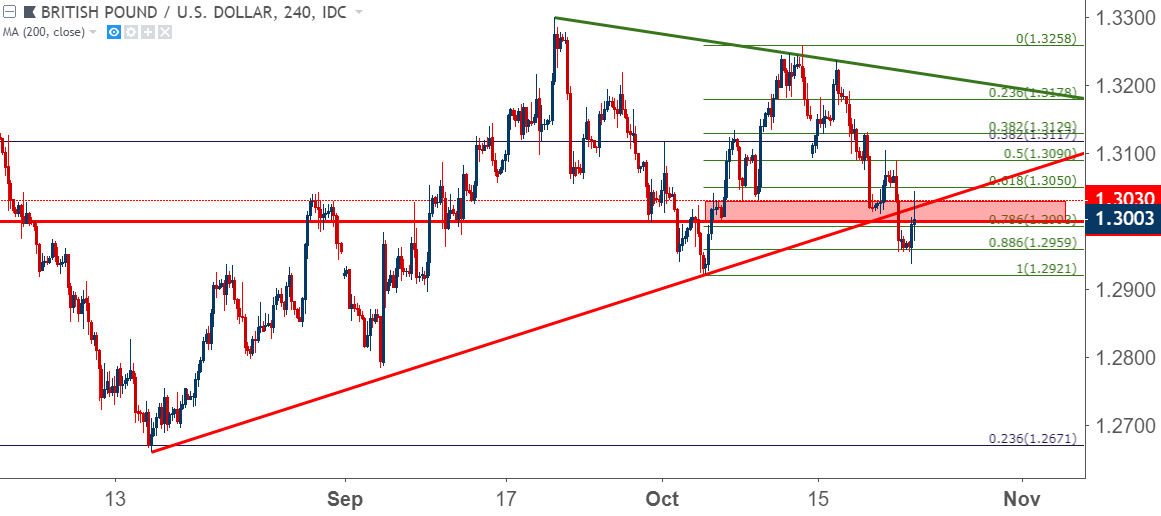
Chart prepared by James Stanley
Yen Strength Comes Back as Risk Aversion Picks Up
As followed during the bulk of the sell-off two weeks ago, Yen strength has taken preference against the US Dollar as markets wind up around another bout of risk aversion. USD/JPY has moved-lower so far this week and the pair is now testing the 50% marker of the August-October major move. There’s also a bullish trend-line that continues to help to mark support, and if prices are unable to hold here, the prior bullish trend is in question as risk aversion will be showing more prominently in the pair.
USD/JPY Four-Hour Price Chart: Approaching a Big Area on the Chart
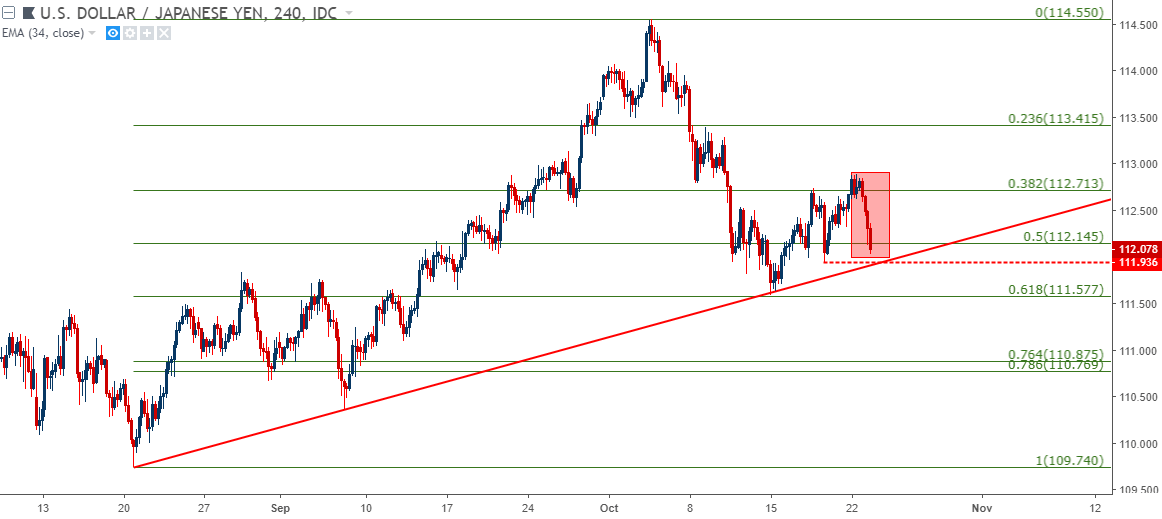
Chart prepared by James Stanley
To read more:
Are you looking for longer-term analysis on the U.S. Dollar? Our DailyFX Forecasts for Q4 have a section for each major currency, and we also offer a plethora of resources on USD-pairs such as EUR/USD, GBP/USD, USD/JPY, AUD/USD. Traders can also stay up with near-term positioning via our IG Client Sentiment Indicator.
Forex Trading Resources
DailyFX offers a plethora of tools, indicators and resources to help traders. For those looking for trading ideas, our IG Client Sentiment shows the positioning of retail traders with actual live trades and positions. Our trading guides bring our DailyFX Quarterly Forecasts and our Top Trading Opportunities; and our real-time news feed has intra-day interactions from the DailyFX team. And if you’re looking for real-time analysis, our DailyFX Webinars offer numerous sessions each week in which you can see how and why we’re looking at what we’re looking at.
If you’re looking for educational information, our New to FX guide is there to help new(er) traders while our Traits of Successful Traders research is built to help sharpen the skill set by focusing on risk and trade management.
--- Written by James Stanley, Strategist for DailyFX.com
Contact and follow James on Twitter: @JStanleyFX


