


Forex Talking Points:
- US Dollar strength continues to show in a visible manner after the earlier-week breach of 95.00 support. Dollar strength is helping to drive near-term lows in both EUR/USD and GBP/USD. Will this flare of USD strength turn into something more after the past few weeks have brought multiple failures at the 96.00 level?
- Global equities are showing consolidation after the Tuesday bounce held through yesterday’s price action. This keeps the door open for topside strategies in both the Dow and S&P 500; but with both markets hovering above key short-term support variables, those short-side drives could come back quickly should another nasty wave of price action develop.
- DailyFX Forecasts on a variety of currencies such as the US Dollar or the Euro are available from the DailyFX Trading Guides page. If you’re looking to improve your trading approach, check out Traits of Successful Traders. And if you’re looking for an introductory primer to the Forex market, check out our New to FX Guide.
Do you want to see how retail traders are currently trading the US Dollar? Check out our IG Client Sentiment Indicator.
EUR/USD Bounces From 1.1500 Support
Euro bears have come back into the picture after EUR/USD tested a key zone of resistance again this week. That resistance resides from 1.1590-1.1625, and this is the same area that had helped to hold the highs last week. Prices topped-out last Thursday as risk aversion themes were in full view, and after a pullback to 1.1530, buyers pushed right back into the resistance zone in the early portion of this week. But since prices topped out at 1.1622 on Tuesday, sellers have been on the attack, and price action has moved in a rather consistent trend as the 1.1500 psychological level has come back into play.
EUR/USD Four-Hour Price Chart
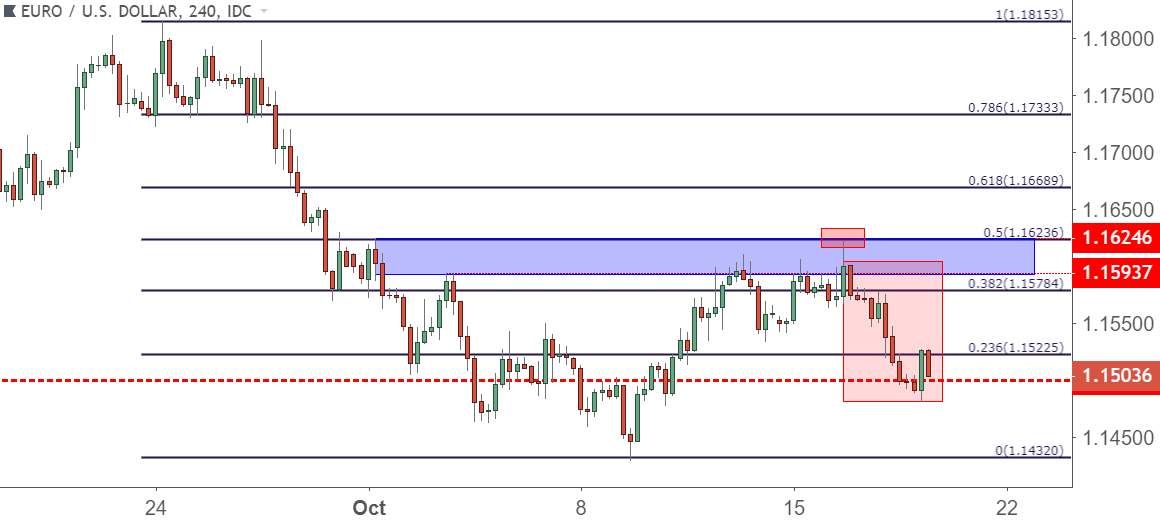
Chart prepared by James Stanley
The big question at this point is whether bears can pose a lasting push in the pair. To be sure, prices have tested below 1.1500 multiple times over the past few months, largely on the basis of risk aversion building around the Euro-Zone and the continued scenario with Italy. But each time, at least so far, sellers have stepped back from the ledge and prices have reverted back into the prior range. This could make bearish EUR/USD plays a bit more of a challenge with current price action, at least until last week’s low is taken out, as we now have some under-side support structure that could further thwart bearish runs.
EUR/USD Daily Price Chart

Chart prepared by James Stanley
GBP/USD: Cable Grasps at Support as Sellers Persist
Dollar strength has remained fairly pronounced against the British Pound, as well, and prices are bouncing from fresh weekly lows while trying to hold support above the 1.3100 level. This comes after another failure from bulls to push through the 1.3200 level as was seen earlier this week, and this is building a backdrop for further consolidation as prices have now posted both lower-highs and higher-lows.
GBP/USD Daily Price Chart: Cable Consolidates into Symmetrical Wedge

Chart prepared by James Stanley
On a shorter-term basis, there is the potential for a bearish move lower as prices test the support side of the above consolidation. The trend-line taken from the September and October swing-lows currently projects around the 1.3000 level, and from the hourly chart, the lower-lows and lower-highs that have printed can keep the door open for short-term bearish plays in the pair.
GBP/USD Hourly Price Chart

Chart prepared by James Stanley
USD/JPY Attempts to Build Bullish Base
Last week’s risk aversion was fairly pronounced throughout global equity markets; but in currencies, it was mostly more of the same price action that had been showing for the bulk of the summer. The one notable exception was USD/JPY, which developed a consistent down-trend after topping out on October 3rd, right around the time that global equities did the same. Last week’s selling in stocks was coupled with a consistent stream of bearish price action in USD/JPY, and this pushed prices all the way down from a fresh 2018 high above 114.50, to the support/resistance level at 111.64 that played out through the summer.
Since that low came in on Monday, buyers have been staging a push higher, and prices have now put in a couple of higher-highs to go along with a fresh higher-low. Buyers appear to be trying to furnish support around an area of prior resistance, and this takes place around the 76.4% Fibonacci retracement of the November 2017-March 2018 major move.
This theme has come-in along in a similar, albeit less-jagged manner as what’s been seen in US stocks.
USD/JPY Hourly Price Chart

Chart prepared by James Stanley
US Equities Attempt to Stabilize After Volatility Spike
US equities continue to try to regain footing after last week’s sell-off. I had looked into the Dow Jones Industrial Average yesterday near the US equity close, and that support structure remains as we near the Thursday open. The Fibonacci retracement produced by the Q3 bullish move continues to carry weight, as both the 38.2% retracement and the 50% marker came into play yesterday. The 50% marker helped to catch the morning’s lows after resistance had previously come-in off of the 38.2% retracement. This, at the very least, helps to provide a bit of context to the matter, and for traders that do want to look for a return of bearish price action, a break down through support at the 50% marker could make that look more attractive. Until then, the bias will likely be to the upside as price action attempts to recover from last week’s sell-off.
Dow Jones Hourly Price Chart: Consolidation After Recovery Bounce
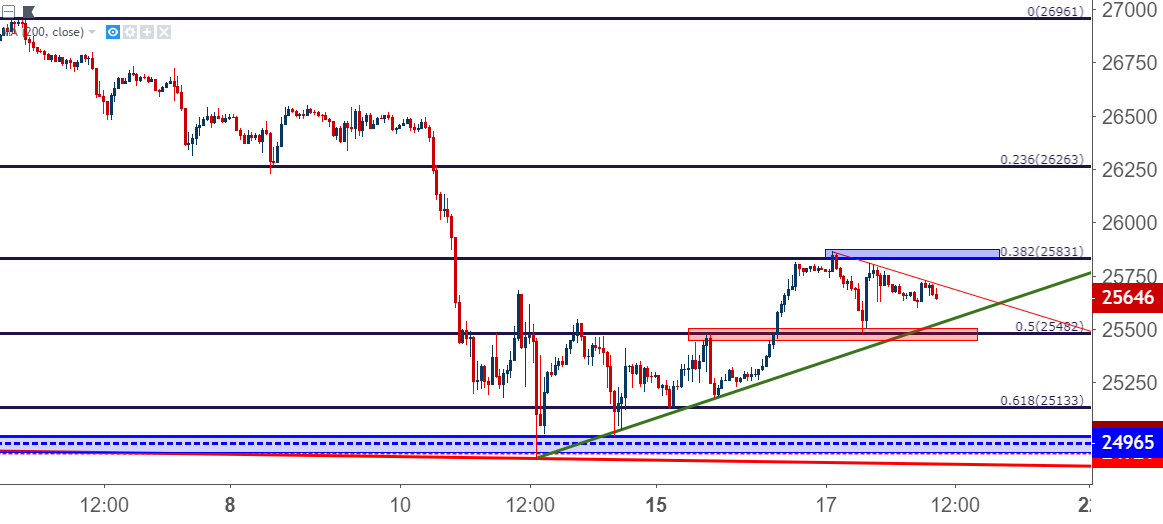
Chart prepared by James Stanley
S&P 500
In the S&P, there’s been a similar build of support after this week’s recovery bounce came into play. The big level or area to watch appears to be around the 2780 area, as 2784 is the 38.2% retracement of the January-October bullish run. This price helped to set some short-term support yesterday, and a trend-line taken off of the lows from last week to this week currently projects to around this area.
SPX 500 Hourly Price Chart
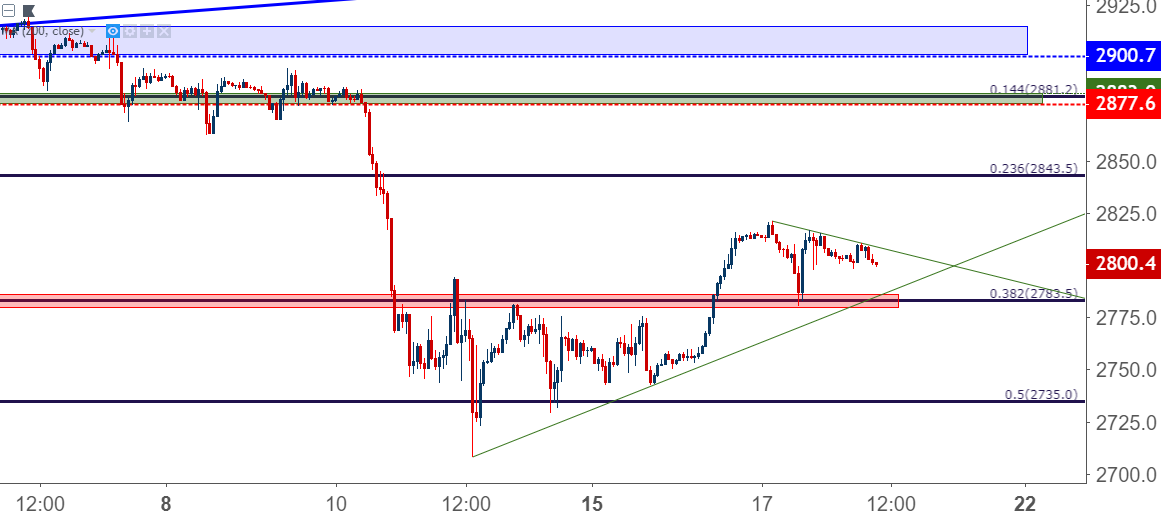
Chart prepared by James Stanley
To read more:
Are you looking for longer-term analysis on the U.S. Dollar? Our DailyFX Forecasts for Q4 have a section for each major currency, and we also offer a plethora of resources on USD-pairs such as EUR/USD, GBP/USD, USD/JPY, AUD/USD. Traders can also stay up with near-term positioning via our IG Client Sentiment Indicator.
Forex Trading Resources
DailyFX offers a plethora of tools, indicators and resources to help traders. For those looking for trading ideas, our IG Client Sentiment shows the positioning of retail traders with actual live trades and positions. Our trading guides bring our DailyFX Quarterly Forecasts and our Top Trading Opportunities; and our real-time news feed has intra-day interactions from the DailyFX team. And if you’re looking for real-time analysis, our DailyFX Webinars offer numerous sessions each week in which you can see how and why we’re looking at what we’re looking at.
If you’re looking for educational information, our New to FX guide is there to help new(er) traders while our Traits of Successful Traders research is built to help sharpen the skill set by focusing on risk and trade management.
--- Written by James Stanley, Strategist for DailyFX.com
Contact and follow James on Twitter: @JStanleyFX


