


US Dollar Talking Points:
- Global equities have finally found some semblance of support after a brutal two-day sell-off. There did not appear to be a singular driver behind the selling, and this perhaps helped to soften the blow a bit; and when taken with the fact that Q3 was a very bullish period for stocks in the US, it becomes easier to qualify this move as a simple correction as opposed to a harbinger of doom as we wind down 2018. Nonetheless, the sell-off happened, and until markets see a convincing return of bullish price action, caution should be utilized across the equity space.
- For all intents and purposes, currencies were relatively calm during this equity rout. There were consistent patterns of weakness in the US Dollar and this drove strength into both EUR/USD and GBP/USD but, nothing appeared out of the norm as all three of those markets were working within the context of prior price action.
- DailyFX Forecasts on a variety of currencies such as the US Dollar or the Euro are available from the DailyFX Trading Guides page. If you’re looking to improve your trading approach, check out Traits of Successful Traders. And if you’re looking for an introductory primer to the Forex market, check out our New to FX Guide.
Do you want to see how retail traders are currently trading the US Dollar? Check out our IG Client Sentiment Indicator.
Global Equities Catch Support, but Can it Hold?
This week has brought an interesting twist as a global stock sell-off caught many by surprise; and this follows what was a very bullish Q3 across a number of indices. The move was very pronounced during Wednesday’s US session, and that pain held through the Asian open. Support began to show in the Dow and S&P and that largely held through yesterday’s European and US opens, with another fresh wave of selling showing up near yesterday’s US close. The Dow quickly moved down to test the 25,000 level and a bounce began to show. Buyers continued to drive overnight, and at this point, we can see prices attempting to hold higher-low support around the 61.8% Fibonacci retracement of the January sell-off in the index.
Dow Jones Hourly Price Chart: Attempted Build of Support After 25k Test

Chart prepared by James Stanley
Next Week’s Economic Calendar
While this week’s economic calendar was rather light, with the highlight being yesterday’s US CPI report, next week’s economic docket is a bit busier, as we have multiple high-impact releases every day Monday-Friday.
DailyFX Economic Calendar High-Impact Events for the Week of October 15, 2018

Chart prepared by James Stanley
US Dollar Bounces From 95.00 After Two-Day Sell-Off
While US equities were plunging on Wednesday and again near yesterday’s US equity close, the US Dollar was in the midst of a fairly consistent sell-off. The currency had initially started the week by bouncing up to resistance, soon finding sellers around the same 96.10 level that had offered resistance last week. But that’s when the music stopped for bulls, and prices trended-lower until we were back to the same 95.00 level that had previously marked the October low.
US Dollar Hourly Price Chart: Support Attempts to Build at 95.00 After Consistent Sell-Off From Resistance

Chart prepared by James Stanley
EUR/USD Comes Off of Resistance After Early-Week Sell-Off
Coming into the week, fears around Italy continued to hold a bearing on EUR/USD price action. In short order, a bear flag formation had broken as the pair traded down to fresh lows. But Tuesday morning saw support build-in around 1.1430, and prices put in a rather consistent pullback (going along with that consistent sell-off in the US Dollar), until a an interesting area of resistance came into play around the 1.1600-handle.
EUR/USD Four-Hour Price Chart: Euro Softens Near Resistance

Chart prepared by James Stanley
At this stage, either side of the trade could be justified and for those without an overriding bias, steering clear and letting matters clean up a bit could be the most attractive way of moving forward. If we do see a topside break of this resistance zone, the door appears open for a re-test of the longer-term resistance area around 1.1736. If we break back-below 1.1500, then we’re likely seeing a re-emergence of fears around Italy, and that can bring on panic-like selling as investors duck for cover.
EUR/USD Two-Hour Price Chart

Chart prepared by James Stanley
EUR/JPY Catches Support Within Bull Flag
Coming into this week, EUR/JPY had an interesting setup as there was a bull flag formation on longer-term charts, and inside of that channel was a shorter-term descending triangle formation.
The descending triangle is often approached in a bearish fashion, and in short order that setup had filled in as prices broke down to start this week. That run was fairly pronounced on Monday but, similar to what was seen in EUR/USD, support began to catch mid-week and prices tilted higher. At this stage, resistance continues to hold below prior support, but bulls have shown no signs yet of relenting. If we do see a continued Euro recovery, a topside break of this flag could re-open the door to bullish strategies in the pair. The level of interest there would be the zone that runs from 130.59-130.77, as this was prior support from the descending triangle formation, and a topside break through this area also means a bullish push above the channel that makes up the bull flag formation.
EUR/JPY Two-Hour Price Chart: Descending Triangle Break
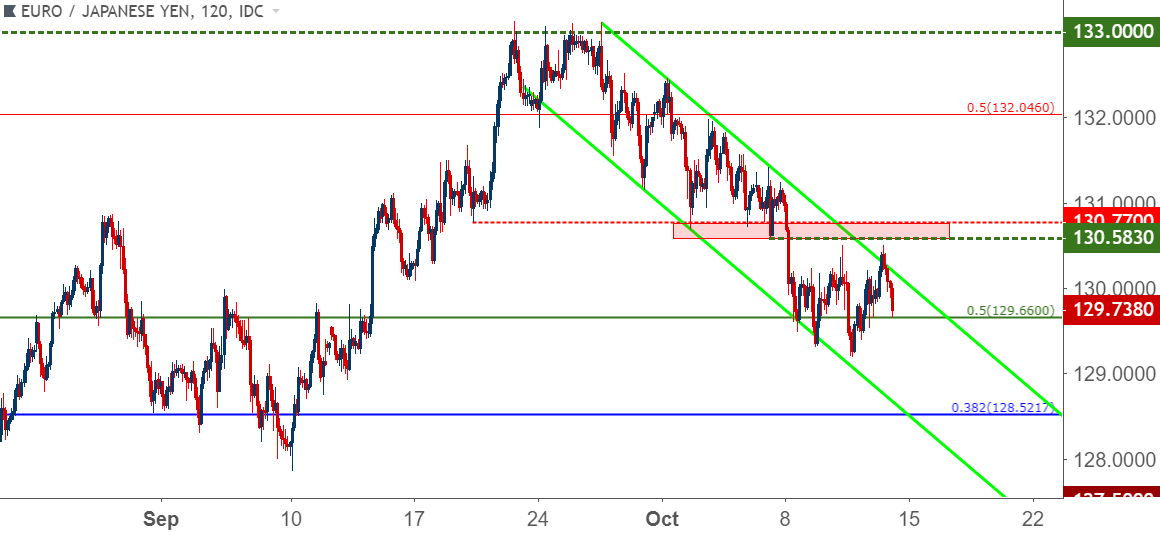
Chart prepared by James Stanley
GBP/USD Pulls Back From Three-Week High, UK Inflation on Deck
Next week brings September inflation numbers out of the UK, and this has been a big driver in the currency of recent. There’s another driver of note, however, as Brexit proceedings continue to produce two-sided volatility; but the lack of further negative developments this week, combined with that weakness in the US Dollar, have helped GBP/USD to push up to fresh three-week-highs.
The long side of GBP/USD was highlighted in this week’s FX Setups of the week, looking to the key Fibonacci level at 1.3117 as a market for topside plays.
With prices now pulling back, the big question is where that next item of support may come in, and there have been a few areas of note in GBP/USD this week. The 1.3030 level was highlighted as part of the technical write-up on the pair that was released on Tuesday, and after a bullish push another area of swing resistance turned support developed at 1.3133. There’s also the zone of interest that runs from 1.3098-1.3117, so there is a backdrop for working with bullish strategies on the pair as we move into next week.
GBP/USD Two-Hour Price Chart

Chart prepared by James Stanley
To read more:
Are you looking for longer-term analysis on the U.S. Dollar? Our DailyFX Forecasts for Q4 have a section for each major currency, and we also offer a plethora of resources on USD-pairs such as EUR/USD, GBP/USD, USD/JPY, AUD/USD. Traders can also stay up with near-term positioning via our IG Client Sentiment Indicator.
Forex Trading Resources
DailyFX offers a plethora of tools, indicators and resources to help traders. For those looking for trading ideas, our IG Client Sentiment shows the positioning of retail traders with actual live trades and positions. Our trading guides bring our DailyFX Quarterly Forecasts and our Top Trading Opportunities; and our real-time news feed has intra-day interactions from the DailyFX team. And if you’re looking for real-time analysis, our DailyFX Webinars offer numerous sessions each week in which you can see how and why we’re looking at what we’re looking at.
If you’re looking for educational information, our New to FX guide is there to help new(er) traders while our Traits of Successful Traders research is built to help sharpen the skill set by focusing on risk and trade management.
--- Written by James Stanley, Strategist for DailyFX.com
Contact and follow James on Twitter: @JStanleyFX


