


US Dollar Talking Points:
- The US Dollar has opened the week with a spate of strength, and this comes after the disappointing NFP print that was released on Friday to a tune of 134k jobs added in the US for the month of September. This was well-below the +185k expectation, but the internals of the report weren’t all that bad as the unemployment rate came in better-than-expectations at 3.7%; and Average Hourly Earnings remained strong at .3%, 2.8% annualized.
- The Euro is selling off and Italian bond yields are continuing to widen as fears percolate around the brewing situation in Europe. This has now started to impact the Yen as strength is showing in the currency after what had become a consistently-weak prior month of price action. And European equities are getting hit, as we looked at in our technical forecast coming into this week.
- DailyFX Forecasts on a variety of currencies such as the US Dollar or the Euro are available from the DailyFX Trading Guides page. If you’re looking to improve your trading approach, check out Traits of Successful Traders. And if you’re looking for an introductory primer to the Forex market, check out our New to FX Guide.
Do you want to see how retail traders are currently trading the US Dollar? Check out our IG Client Sentiment Indicator.
Dollar Strength to Begin the Week – A Light Macro Calendar Ahead
The second week of Q4 has opened in a big way, with another run of Euro weakness and US Dollar strength as a number of themes remain in the spotlight. Italian bonds are continuing to get hit, furthering the fear that started to re-emerge over the past couple of weeks – and this is continuing to take a toll on global stocks as risk aversion remains a prominent driver.
This week’s economic calendar is a bit light on macro issues, with the primary item of interest coming from US inflation set to be released on Thursday morning. Outside of macro data releases, we do have a few additional items of interest, as we’ll hear from a few Fed speakers along with the start of Q3 earnings out of the United States.
But – from where we’re sitting now, there is one big issue that will likely remain at the forefront of market volatility – and that’s the brewing situation in Italy and how this may affect the European economy in the months or even years ahead.
DailyFX Economic Calendar: US Inflation the Highlight, But Attention Remains on Italy
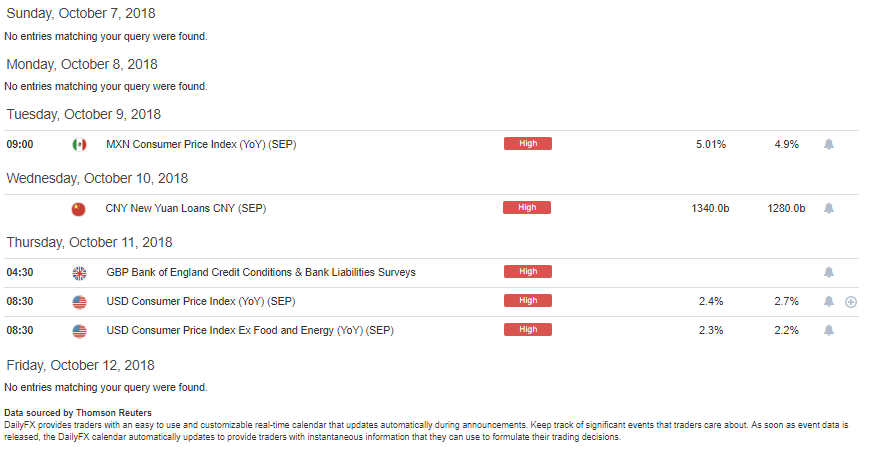
Chart prepared by James Stanley
Euro Opens the Week With a Dip Despite Hawkish Hints from Knot
This week has opened with an extension of weakness in Euro price action that’s shown so far in Q4, and this morning has brought some hawkish comments from the ECB’s Klass Knot regarding near-term interest rate policy. Mr. Knot said that the bank will begin to discuss timing of rate hikes in January, and while he stood by the previous proclamation that rates will stay at current levels ‘at least through the summer of 2019,’ he did qualify this by pointing out that its merely an expectation – and it’s possible to see rate hikes ahead of this time despite the confidence that was displayed by Mr. Draghi when being questioned on that timing in June.
These comments appear to have helped to stall the decline in the single currency so far on the fresh week. This comes after a fairly concerted bout of selling appeared on the open and drove through the Asian session and into the European open. This bearish drive comes after the pair put in a re-test at a key level after Non-Farm Payrolls on Friday of last week.
EUR/USD 30-Minute Price Chart: Selling at the Open, Bears Slow Ahead of Fresh Lows
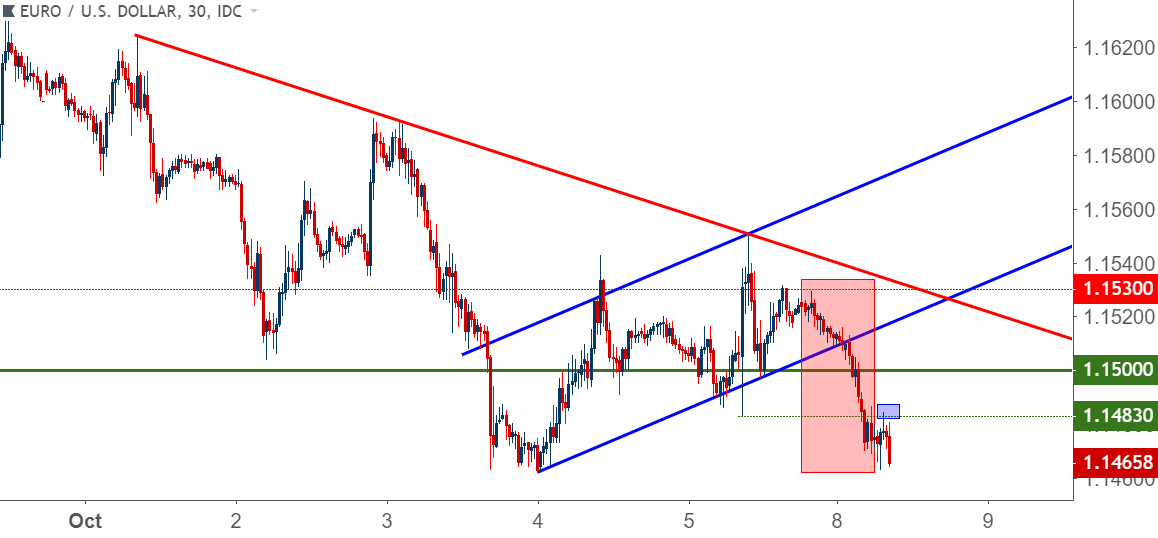
Chart prepared by James Stanley
We looked into the EUR/USD pair as part of our FX Setups of the Week, looking for a break of last week’s higher-low to open the door for bearish strategies in the pair. Last week helped to produce a bear flag formation in the pair, and that formation began to give way in the overnight session.
EUR/USD Hourly Price Chart: Bear Flag Break, Bearish Trend-Line Holds

Chart prepared by James Stanley
Yen Strength Begins to Show as Risk Aversion Remains
As an indicator of risk aversion, that prior theme of Yen weakness has started to further come undone, pointing to the fact that we’re seeing somewhat of a flight-to-quality. We also looked into EUR/JPY as part of our FX Setups of the Week, looking for a downside break of support to open the door to a run to 130.00 or, perhaps even deeper. That move has already started to play out as the pair put in a run down to a fresh three-week-low at the 130.00 level. As we had written, there was a shorter-term descending triangle formation inside of a longer-term bull flag formation. The descending triangle has already begun to fill in, and the door remains open to deeper downside tests in the pair.
EUR/JPY Hourly Price Chart: Descending Triangle Breakdown Re-Test of 130.00
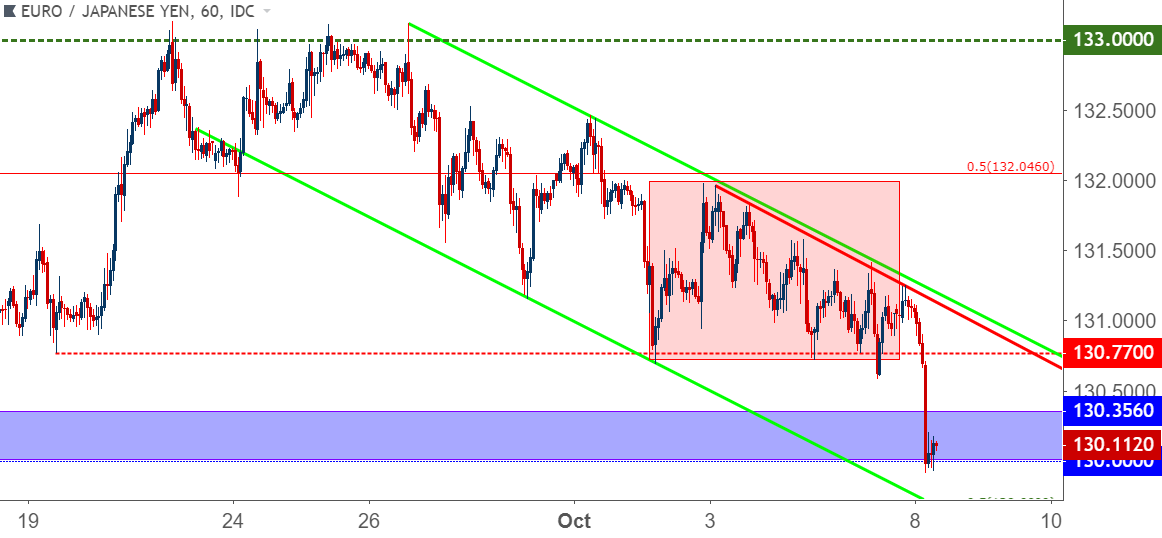
Chart prepared by James Stanley
US Dollar Bulls Push Towards Prior Highs
Going along with this scenario around risk aversion has been a topside push in USD that has, so far, stopped short just shy of the prior highs. The level of 96.04 is of interest here, as this is the 50% marker of the 2017-2018 bearish trend in DXY.
Given that we’ve had a hold of the support at the prior resistance of 95.53 that we looked at last week, the door could remain open for bullish strategies here. The price of 95.74 is of interest for higher-low support plays. This was the early-September swing high in the currency, and this price has come back with recent price action to elicit a bit of resistance and short-term support.
US Dollar Hourly Price Chart: Higher-Low Support Potential at Prior September High

Chart prepared by James Stanley
USD/JPY Breaks the Chain – Look out Below
We had looked at the consistent up-trend that had driven USD/JPY higher over the prior three weeks, much of the time supported by a bullish trend-line. That formation has soundly broken, and after a check of resistance at prior trend-line support, bears have started to drive-in fresh lower-lows and lower-highs.
This is another signal of risk aversion as the Yen can often take preference over the US Dollar during such a scenario; largely on the basis of unwind of short-Yen positions as investors duck for cover. This would still be at the very early stages, but it bears watching as a further drive of Yen-strength will likely go along with a continuation of risk aversion.
USD/JPY Two-Hour Price Chart: Trend-Line Breakdown to Fresh Near-Term Lows
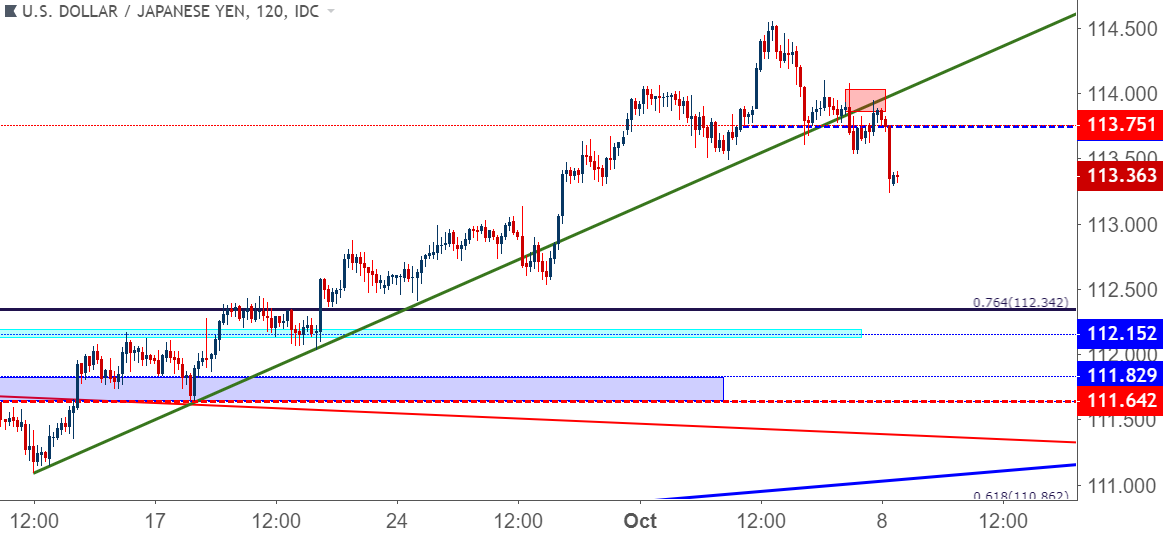
Chart prepared by James Stanley
British Pound Pulls Back – Will Bulls Come Back for Support at Prior Resistance
The latter portion of last week produced a fairly pronounced drive of strength in the British Pound, and prices soon re-engaged with the key Fibonacci level at 1.3117. As we looked at in this week’s FX Setups, this has been a big level of recent to GBP/USD, and prices simply trading above this price could be received as a positive signal as buyers were able to test above this level, even if only temporarily.
Going along with this morning’s drive of risk aversion and USD strength, GBP/USD is pulling back, and we’re currently seeing a hold of the declines around an area of prior short-term resistance.
The big question here is whether buyers can hold the line above the 1.3000 psychological level. If we do see a hold of support at current levels, the door could be opened for topside plays with targets re-directed at that 1.3117 level, with stops lodged below the psychological level of 1.3000.
GBP/USD Hourly Price Chart: Pullback from Key Fibonacci Level

Chart prepared by James Stanley
To read more:
Are you looking for longer-term analysis on the U.S. Dollar? Our DailyFX Forecasts for Q3 have a section for each major currency, and we also offer a plethora of resources on USD-pairs such as EUR/USD, GBP/USD, USD/JPY, AUD/USD. Traders can also stay up with near-term positioning via our IG Client Sentiment Indicator.
Forex Trading Resources
DailyFX offers a plethora of tools, indicators and resources to help traders. For those looking for trading ideas, our IG Client Sentiment shows the positioning of retail traders with actual live trades and positions. Our trading guides bring our DailyFX Quarterly Forecasts and our Top Trading Opportunities; and our real-time news feed has intra-day interactions from the DailyFX team. And if you’re looking for real-time analysis, our DailyFX Webinars offer numerous sessions each week in which you can see how and why we’re looking at what we’re looking at.
If you’re looking for educational information, our New to FX guide is there to help new(er) traders while our Traits of Successful Traders research is built to help sharpen the skill set by focusing on risk and trade management.
--- Written by James Stanley, Strategist for DailyFX.com
Contact and follow James on Twitter: @JStanleyFX


