


US Dollar Talking Points:
- The US Dollar is pulling back from fresh seven-week highs as the currency has been in a near-parabolic run over the past week. A bit of resistance has started to show around the 96.00 level, and this keeps the door open for support potential at prior points of resistance at 95.53 and 95.00. Tomorrow brings September Non-Farm Payrolls data to markets, and the expectation is for +185k jobs to have been added to American payrolls last month. As has become usual with these releases, intense focus will be on the details contained within the report, specifically Average Hourly Earnings for signals of wage inflation.
- After spending most of Q3 finding support at 1.1530, EUR/USD has quickly tested below that level to open up Q4. The European Central Bank begins tapering bond purchases this month, and it comes at somewhat of an inopportune time as pressure has started to show around Italian bonds. As Italian bond yields have moved up, we’ve seen additional selling in the Euro, and this is a theme that could remain of interest as we move deeper into Q4.
- DailyFX Forecasts on a variety of currencies such as the US Dollar or the Euro are available from the DailyFX Trading Guides page. If you’re looking to improve your trading approach, check out Traits of Successful Traders. And if you’re looking for an introductory primer to the Forex market, check out our New to FX Guide.
Do you want to see how retail traders are currently trading the US Dollar? Check out our IG Client Sentiment Indicator.
US Dollar Pushes Up to Seven-Week-Highs Ahead of NFP
Q4 has started in a directional manner across FX, and tomorrow brings the September Non-Farm Payrolls report to markets. The expectation is for 185k jobs to have been added to American payrolls last month, to go along with an unemployment rate of 3.8% and Average Hourly Earnings at .3%, or 2.8% annualized.
For its part, the US Dollar moves into that NFP report after a very strong past two weeks. The currency has been near-parabolic as we closed down Q3 and opened into Q4. We’ve finally found a bit of short-term resistance around the 96.00 handle, as 96.04 is the 50% retracement of last year’s down-trend in the US Dollar.
US Dollar Eight Hour Price Chart: US Dollar Strength Unleashed

Chart prepared by James Stanley
The big question around the Dollar as we move towards NFP is whether we can catch a pullback that could allow for topside entry. Given the scope of the recent bullish run, combined with the longer-term backdrop from around a few key levels, that door can very much remain open. The resistance we looked at yesterday around 95.53 has been at work since July when this level helped DXY to top-out, and this provided a bit of short-term resistance on Tuesday. A bit lower, the level of 95.00 could also be used for higher-low support plays, as this helped to elicit a bit of support ahead of the Q3 close and shortly after the Q4 open.
US Dollar Four-Hour Price Chart

Chart prepared by James Stanley
EUR/USD Tests Below 1.1500
Given the drama that took place around 1.1530 this year in EUR/USD, this fact may be a bit surprising: EUR/USD put in a break of the 1.1500 psychological level earlier this morning.
EUR/USD Eight-Hour Price Chart

Chart prepared by James Stanley
When we came into May, the Euro was plummeting as fears around Italy enveloped the currency’s price action. That fear lasted throughout the month, and as we neared the June open, a swing-low developed around 1.1530 as prices ranged into a key ECB rate decision. But at that ECB rate decision, support held around the 1.1530 level and that remained through July. Once we came into August, however, another threat had availed itself and that caused even more selling in the Euro. We broke below 1.1530 in the first part of the month, but that move couldn’t last and a little over a week later prices had broken back-above. This level then gave us support in late-August along with a couple of iterations in September, but now that we’ve broken down, the big question is whether we see sellers re-utilize this former support as fresh resistance.
EUR/USD Four-Hour Price Chart: Resistance Potential Around Prior Support
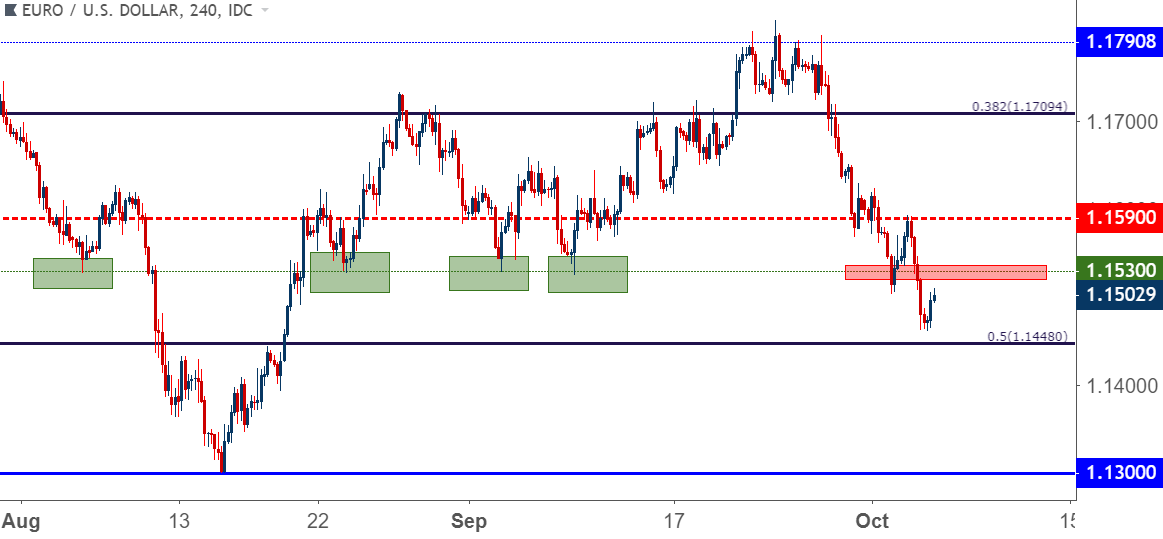
Chart prepared by James Stanley
GBP/USD: Cable Bounces From Bottom of Support Zone, Finds Resistance at 1.3000
We looked into GBP/USD as the currency had just started to test a support zone that runs from 1.2918 up to 1.2956. Prices continued to test-lower until, eventually, buyers came-in ahead of test of 1.2920. Since then we’ve seen a reversion to the 1.3000 psychological level, and we’ve even seen some short-term resistance develop off of this level.
GBP/USD Price Two-Hour Price Chart
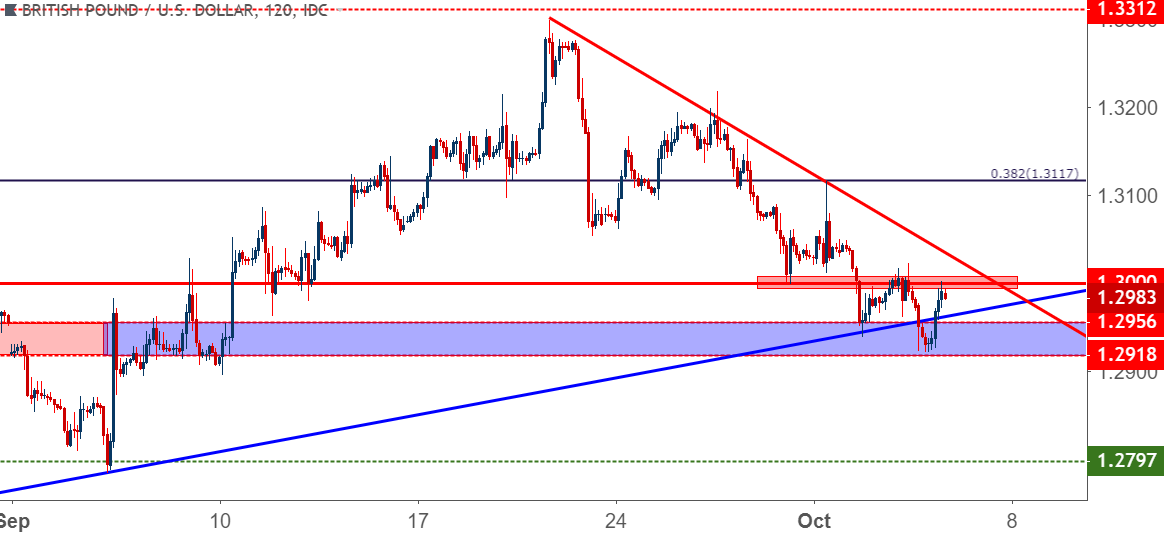
Chart prepared by James Stanley
USD/JPY Pulls Back from Fresh Yearly Highs
The bullish trend in USD/JPY continued up to fresh yearly highs yesterday, and we’ve seen a pullback develop in the European session as the trend softens following a really strong month-long run. The area of interest here seems to be very close to near-term price action, as we have a prior swing-high around the 114.00 handle to go along with a prior swing-low around 1.1375. A pullback to support in this area keeps the door open for bullish strategies, targeting a test of the 115.00 psychological level.
USD/JPY Two-Hour Price Chart

Chart prepared by James Stanley
To read more:
Are you looking for longer-term analysis on the U.S. Dollar? Our DailyFX Forecasts for Q3 have a section for each major currency, and we also offer a plethora of resources on USD-pairs such as EUR/USD, GBP/USD, USD/JPY, AUD/USD. Traders can also stay up with near-term positioning via our IG Client Sentiment Indicator.
Forex Trading Resources
DailyFX offers a plethora of tools, indicators and resources to help traders. For those looking for trading ideas, our IG Client Sentiment shows the positioning of retail traders with actual live trades and positions. Our trading guides bring our DailyFX Quarterly Forecasts and our Top Trading Opportunities; and our real-time news feed has intra-day interactions from the DailyFX team. And if you’re looking for real-time analysis, our DailyFX Webinars offer numerous sessions each week in which you can see how and why we’re looking at what we’re looking at.
If you’re looking for educational information, our New to FX guide is there to help new(er) traders while our Traits of Successful Traders research is built to help sharpen the skill set by focusing on risk and trade management.
--- Written by James Stanley, Strategist for DailyFX.com
Contact and follow James on Twitter: @JStanleyFX


