


Talking Points:
- The US Dollar is breaking-down to fresh two-month lows and EUR/USD appears to be on the verge of a bullish breakout to fresh two-month highs. Both charts are testing through key areas at the moment, and with six-and-a-half trading days until the end of Q3, it appears as though markets are ready to push fresh themes in these major FX markets.
- The big question here is whether this helps Q4 to re-engage the bearish trend that dominated the US Dollar’s price action for much of 2017 and the first quarter of 2018. Q2 brought two months of strength to the Greenback and somewhat of a respite in that oversold move. But as we’ve seen in Q3, Dollar bulls have continually failed to push-forward despite a seemingly friendly backdrop for doing so; and this has helped the Dollar to breakdown as we near the open of Q4 and the end of what’s been a rocky 2018 for USD.
- DailyFX Forecasts on a variety of currencies such as the US Dollar or the Euro are available from the DailyFX Trading Guides page. If you’re looking to improve your trading approach, check out Traits of Successful Traders. And if you’re looking for an introductory primer to the Forex market, check out our New to FX Guide.
Do you want to see how retail traders are currently trading the US Dollar? Check out our IG Client Sentiment Indicator.
US Dollar: Descending Wedge Breaks, Dollar Drives to Fresh Two-Month Lows
The US Dollar is on the move this morning as the currency has broken below the August-September support that had helped to hold up prices through this week. As we’ve shared previously, the fact that bears continued to tip-toe below support signaled a possible oncoming breakdown, and both of the resistance zones we were looking to use for short-side plays came into play, with the nearer of those zones helping to show resistance ahead of this current bearish push.
US Dollar Four-Hour Price Chart: Descending Wedge Break-Down

Chart prepared by James Stanley
As we now have just a little over a week before the end of Q3, the big question is whether bears can continue to gain ground as we wind down what’s been a difficult quarter for the US Dollar. Given these fresh lows, the prospect of bearish continuation could remain as attractive; and for those not yet short, a pullback to prior support could open the door for trend-based strategies.
US Dollar Hourly Price Chart: Don’t Chase - Anticipate
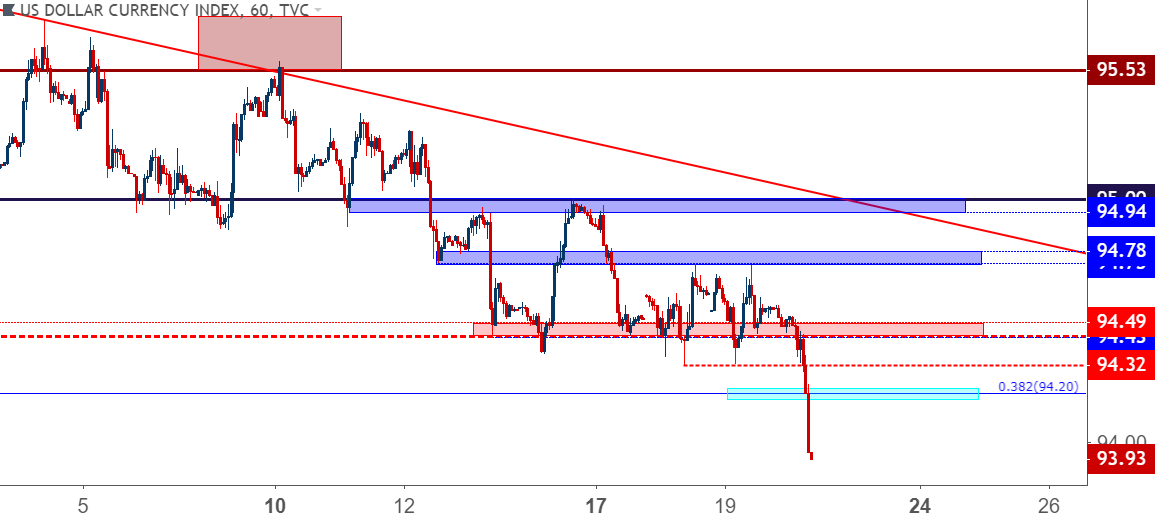
Chart prepared by James Stanley
EUR/USD Breaks Resistance - Can Bulls Sustain?
For the past month-and-change, we’ve been following a key zone of resistance in EUR/USD that runs from 1.1709 up to 1.1750. With 1.1709 being the 38.2% Fibonacci retracement of last year’s bullish move, and with 1.1750 being a major psychological level, there are multiple reasons for sellers to show up around this prices. And that’s largely been taking place since late-July, when this area of the chart held the topside advance until, eventually, sellers had their way in early-August.
But since then bulls have been on parade, and prices have continued to push higher with an increasing frequency of resistance tests. Just this week alone, we’ve seen four such reactions off of this area; but as we shared yesterday, each one appears to be losing power. There’s a bullish trend-line that can be found by connecting the lows since last week. Despite a test below that trend-line yesterday, bulls have remained in charge and prices are back to testing resistance. It doesn’t appear as though this zone will hold up for much longer given the persistent bullish response that we’ve seen.
EUR/USD Hourly Price Chart: Bulls Breaking Fresh Ground
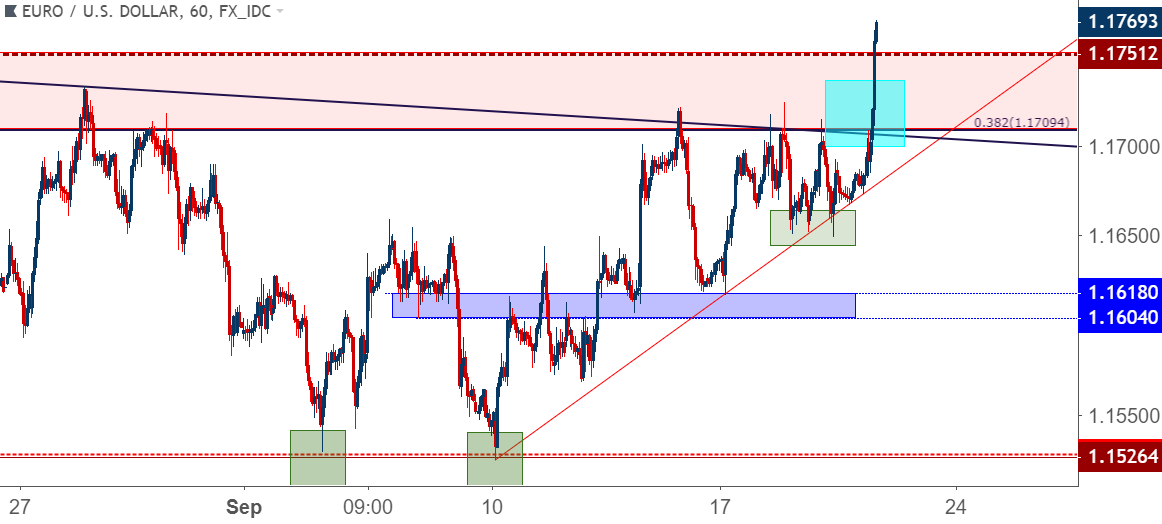
Chart prepared by James Stanley
The big question here is whether bulls can keep up the pace as we wind down Q3. With just a week left in the quarter, buyers would need to muster some additional strength if they want to leave this zone behind; but this does remain as a possibility as the pair is very near fresh three-week-highs.
Speaking to this, EUR/USD is currently testing-above a trend-line that’s held the highs in the pair for much of Q3. The point of substantiation for this trend-line was July 6th, and this connects to the August high. But more recently this trend-line has been helping to cap the advance, and as we can see so far on the morning, we have a strong topside push above this level.
EUR/USD Four-Hour Price Chart: Breaking-Above Q3 Bearish Trend-Line
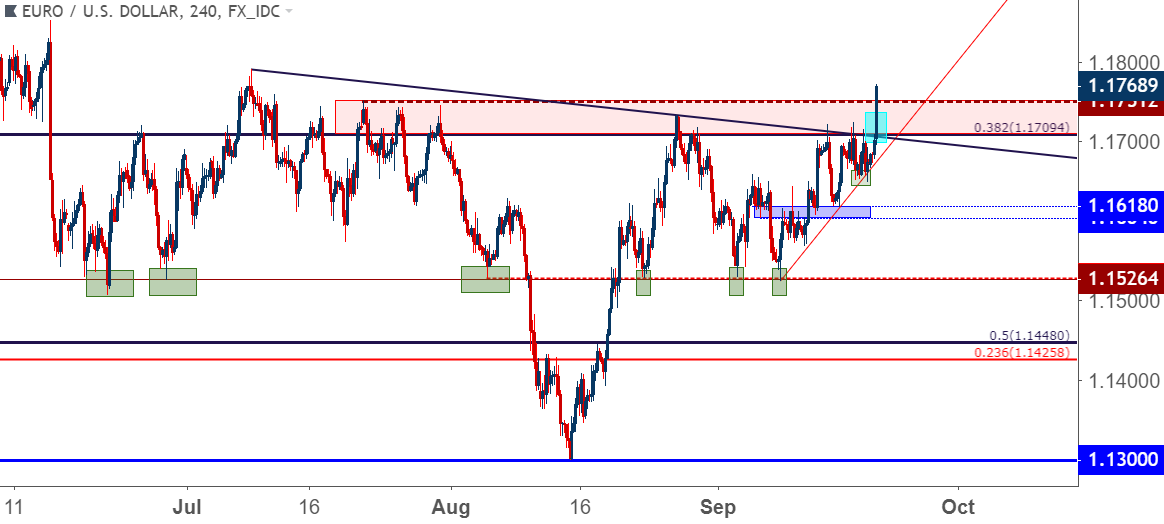
Chart prepared by James Stanley
GBP/USD Jumps to Fresh Two-Month Highs
We looked into the pair yesterday and the British Pound continues to show promise as prices are now pushing up to fresh two-month highs, finding a bit of resistance at the psychological level around 1.3250. This extends what’s been an astounding recovery since the mid-August lows came into play. Below, we look at that move with some scope, while also applying some nearby resistance levels which may serve as stopping points for themes of bullish continuation.
GBP/USD Daily Price Chart: Recovery Extends to Fresh Two-Month Highs
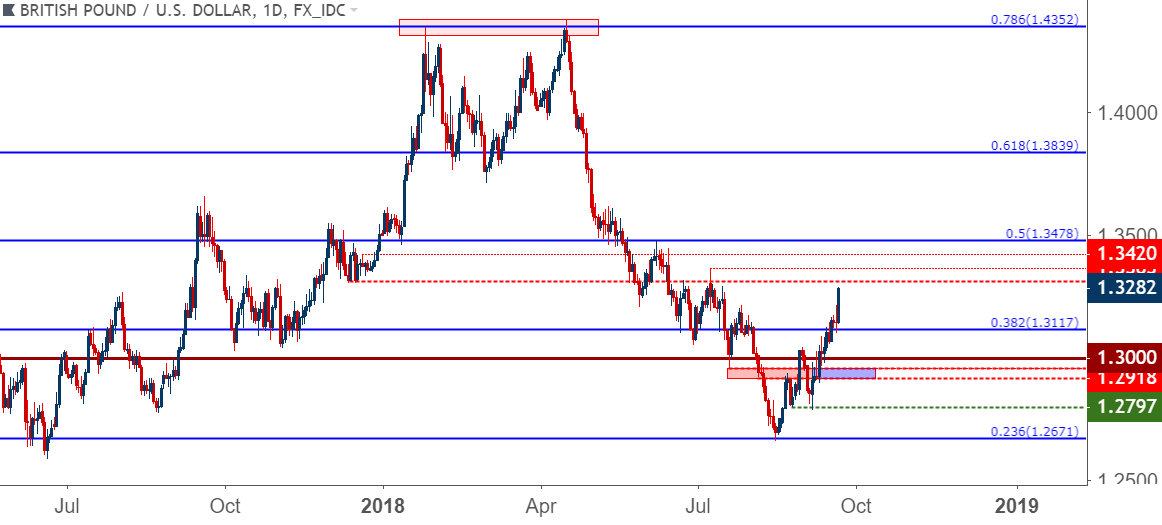
Chart prepared by James Stanley
USD/JPY Holds Higher-Low Support at Prior Resistance
We’ve been following USD/JPY a bit more closely of recent as price action has started to clear up a bit. Last week saw Yen weakness show-up after the US CPI report, and despite the fact that we’ve had a really weak US Dollar – the Japanese Yen has been even weaker and USD/JPY is holding on to those gains. Notably, this weakness did not extend on BoJ, and we do have more headline risk items on the matter with tonight’s release of Japanese inflation numbers combined with LDP elections. But – as we’ve been saying, USD/JPY may not be the best venue for Yen-weakness, as the Dollar appears to be going through its own themes at the moment. More proactively, traders could take that Yen weakness and mesh it up with themes of Euro or British Pound strength, as we look at below.
USD/JPY Four-Hour Price Chart: Holding Higher-Low Support

Chart prepared by James Stanley
EUR/JPY Fresh Two-Month Highs After Earlier-Week Support Check
In our FX Setups for the Week of September 17th, we looked at the topside of EUR/JPY for plays on Yen-weakness, zeroing in on a zone of support from 130-130.35 to look for that higher-low support. That filled in fairly quickly and bulls have been on advance ever since. We’re now seeing fresh two-month-highs in the pair, and this seemingly remains as an attractive venue for both Euro strength and Yen weakness.
For those not yet long, awaiting a pullback to the prior resistance zone around 131.11 seems an adequate manner of moving-forward. This can be connected to the short-term support that showed yesterday around 130.85 to create a zone of interest. We look into this area on the below EUR/JPY chart.
EUR/JPY Hourly Price Chart: Higher-Low Support Potential for Bullish Continuation
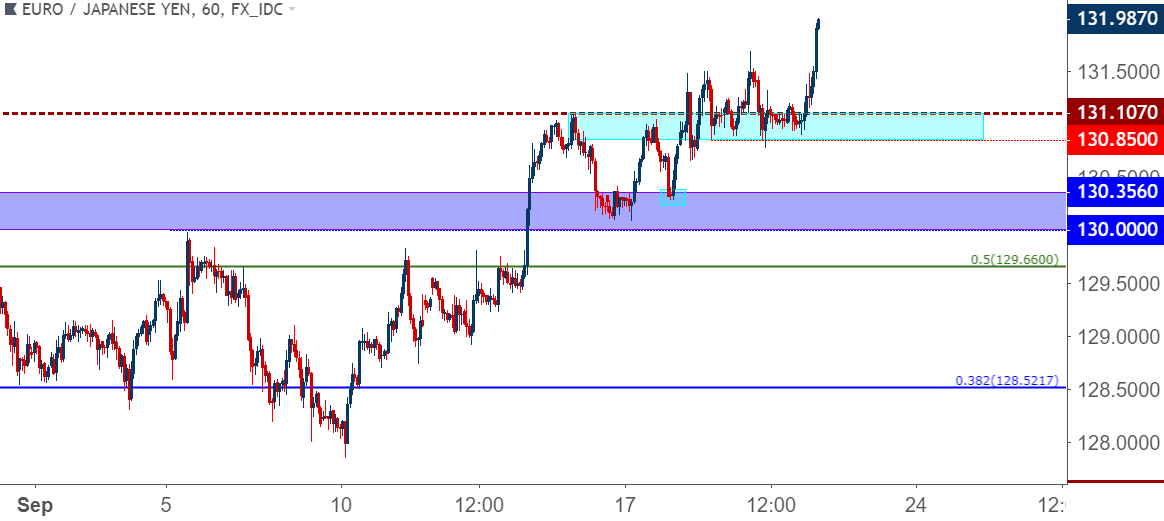
Chart prepared by James Stanley
GBP/JPY Throttles-Higher to Fresh Two-Month Highs
This one may be a bit more difficult to harness than the EUR/JPY that we looked at above, but for those familiar with GBP/JPY, brute volatility should be nothing new. The pair is breaking-out to fresh two month highs, testing above a confluent batch of Fibonacci resistance that had helped to form a swing-high early-yesterday, just ahead of the negative Brexit headlines that gave us the across-the-board GBP pull back. After this resistance came into play, short-term support began to show around the 147.33 area, and this could remain as a usable theme. We’ve connected a group of prior swing-highs to go along with that support to create a zone of interest. Higher-low support here could keep the door open for bullish continuation so that, at the very least, downside risk could be mitigated; as chasing at this point would require a rather wide stop to get risk levels below yesterday’s support.
GBP/JPY Hourly Price Chart
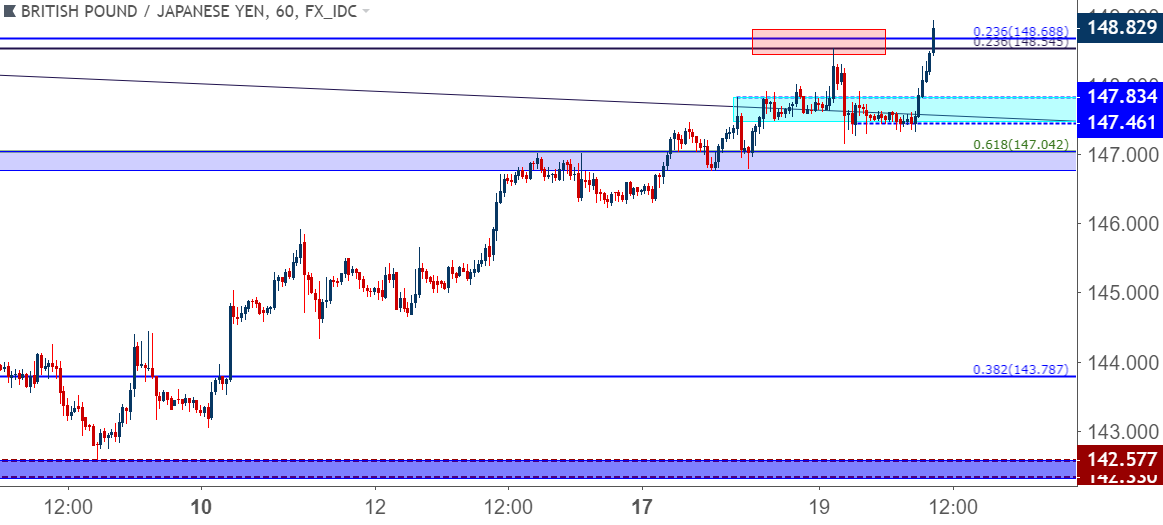
Chart prepared by James Stanley
To read more:
Are you looking for longer-term analysis on the U.S. Dollar? Our DailyFX Forecasts for Q3 have a section for each major currency, and we also offer a plethora of resources on USD-pairs such as EUR/USD, GBP/USD, USD/JPY, AUD/USD. Traders can also stay up with near-term positioning via our IG Client Sentiment Indicator.
Forex Trading Resources
DailyFX offers a plethora of tools, indicators and resources to help traders. For those looking for trading ideas, our IG Client Sentiment shows the positioning of retail traders with actual live trades and positions. Our trading guides bring our DailyFX Quarterly Forecasts and our Top Trading Opportunities; and our real-time news feed has intra-day interactions from the DailyFX team. And if you’re looking for real-time analysis, our DailyFX Webinars offer numerous sessions each week in which you can see how and why we’re looking at what we’re looking at.
If you’re looking for educational information, our New to FX guide is there to help new(er) traders while our Traits of Successful Traders research is built to help sharpen the skill set by focusing on risk and trade management.
--- Written by James Stanley, Strategist for DailyFX.com
Contact and follow James on Twitter: @JStanleyFX


