


Forex Talking Points:
- It’s been a big morning already across the FX-landscape, as we’ve had rate decisions out of Turkey, the UK and Europe. But this morning’s volatility appears to be more driven by a non-Central Bank event, as US Dollar bears have taken over after the release of August inflation numbers out of the US. This has pushed USD/DXY to fresh monthly lows while EUR/USD and GBP/USD have both put in noticeable topside pushes despite a lack of much new information at this morning’s respective rate decisions.
- This makes the prospect of a deeper move of USD-weakness look more likely. We’ve been following the potential for a larger USD breakdown over the past few weeks as signals have started piling up that the two month spate of strength in USD from April and May is losing enthusiasm, and we may be soon nearing another trend of USD-weakness even with a hawkish Fed, much as we saw last year.
- DailyFX Forecasts on a variety of currencies such as the US Dollar or the Euro are available from the DailyFX Trading Guides page. If you’re looking to improve your trading approach, check out Traits of Successful Traders. And if you’re looking for an introductory primer to the Forex market, check out our New to FX Guide.
Do you want to see how retail traders are currently trading the US Dollar? Check out our IG Client Sentiment Indicator.
Inflation Gets the Attention of USD Bears
It’s been a busy morning thus far as we’ve now seen two major rate decisions to go along with the release of August inflation numbers out of the United States. In somewhat of a surprising twist, it’s the inflation print that’s seemed to elicit a bit more volatility than what was seen out of the Bank of England and ECB rate decisions. While both the BoE and ECB came-in largely as expected, US inflation tilted lower and printed inside of the expectation of 2.8%. Last month printed at 2.9% so we were looking for a draw-down as it was; but this morning saw the print come in at 2.7%. This is the first drawdown to headline CPI out of the United States since December of 2017, and the corresponding move in the US Dollar was noticeable.
US Headline CPI Since August, 2017
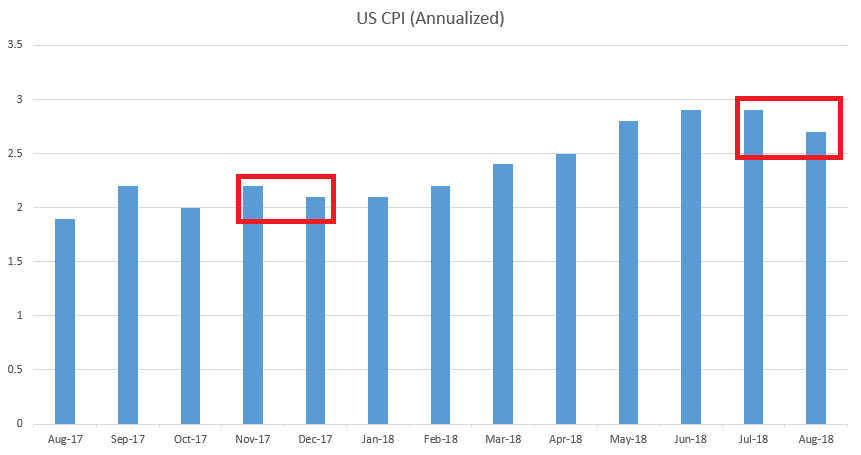
Chart prepared by James Stanley
The US Dollar had largely held the line as we walked into this morning’s BoE and ECB rate decisions, even posing a resistance test at 94.94 in the European session before the festivities got underway. But, as the BoE shared a somewhat expected tone while the ECB announced a widely-telegraphed reduction in bond purchases, USD held the lines of support. The release of August CPI came-in right as the ECB press conference began, and this inflation data certainly appeared to get market participants’ attention as a quick rush of selling showed after the data printed.
US Dollar One-Minute Chart: Bears Take Control at 8:30, Drive to Fresh Monthly Lows
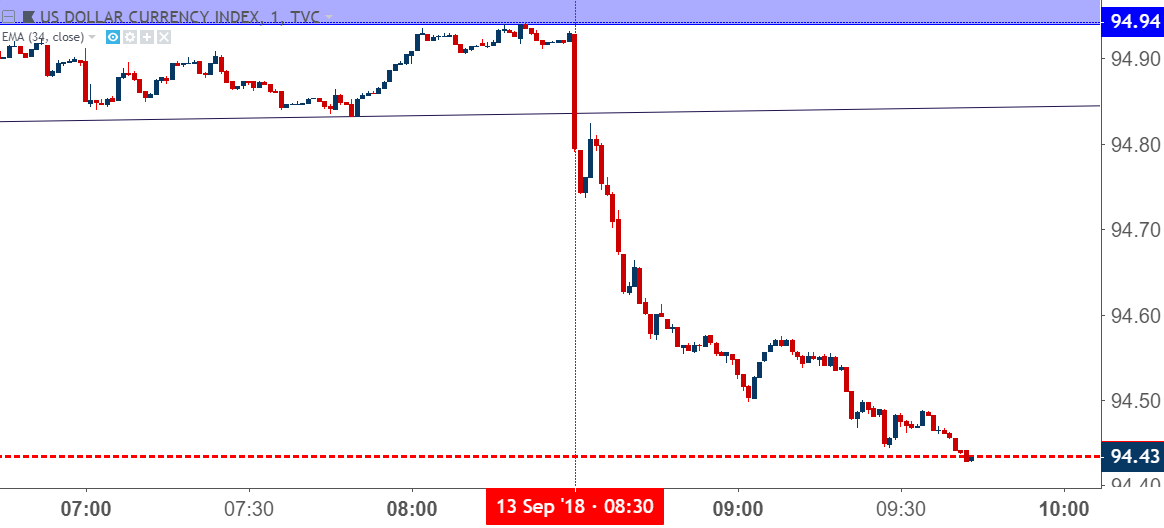
Chart prepared by James Stanley
At this point, the US Dollar is hard-charging at the August swing-lows around the 94.50 level. Given the veracity with which this selling pressure has shown, that support may not be able to hold up the declines for long. If it does elicit a bounce, the door could quickly be re-opened to short-side strategies, looking for that theme of USD weakness to continue on to fresh monthly lows.
US Dollar Hourly Price Chart: Lower-High Resistance Potential for Bearish Continuation
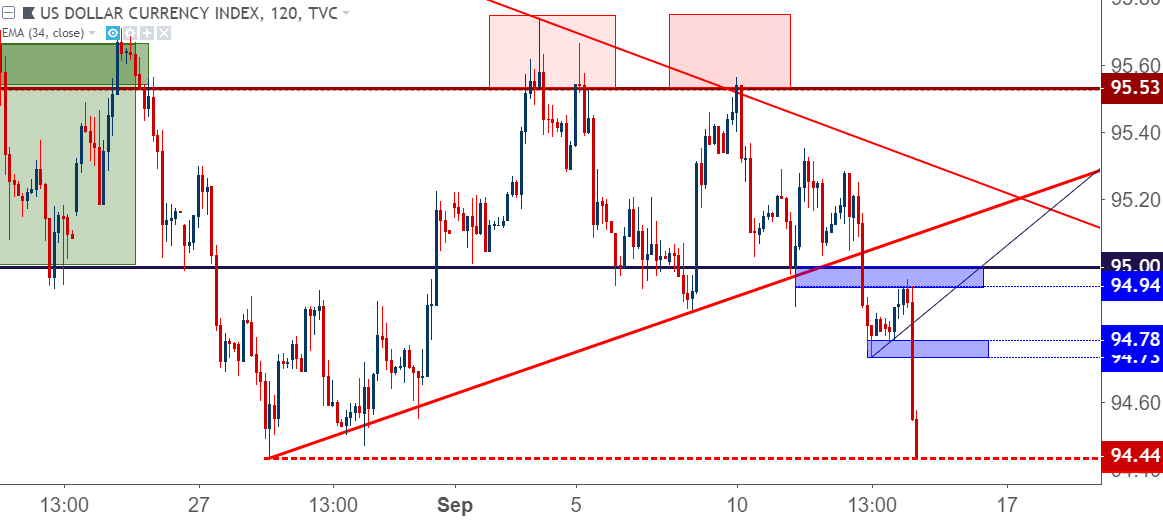
Chart prepared by James Stanley
This adds further evidence towards a topic that we’ve been discussing over the past few weeks, and that’s the prospect of a return of USD weakness.
The US Dollar spent 13 months selling-off from last January into this February. Eventually, DXY ran into the 50% marker of the 2011-2017 major move, and this helped to stall the declines for the next two months; but in April a blip of strength began to show as both EUR/USD and GBP/USD started on bearish reversals. That theme lasted through the month of May, helping the Dollar to lift-up to the 95.00 level on DXY; but the past four months-plus have seen considerable grind take place around that same 95.00 level with bulls unable to sustain any lasting pushes above this area.
US Dollar Monthly Chart: Persistent Failure at 95.00 After April-May Bounce
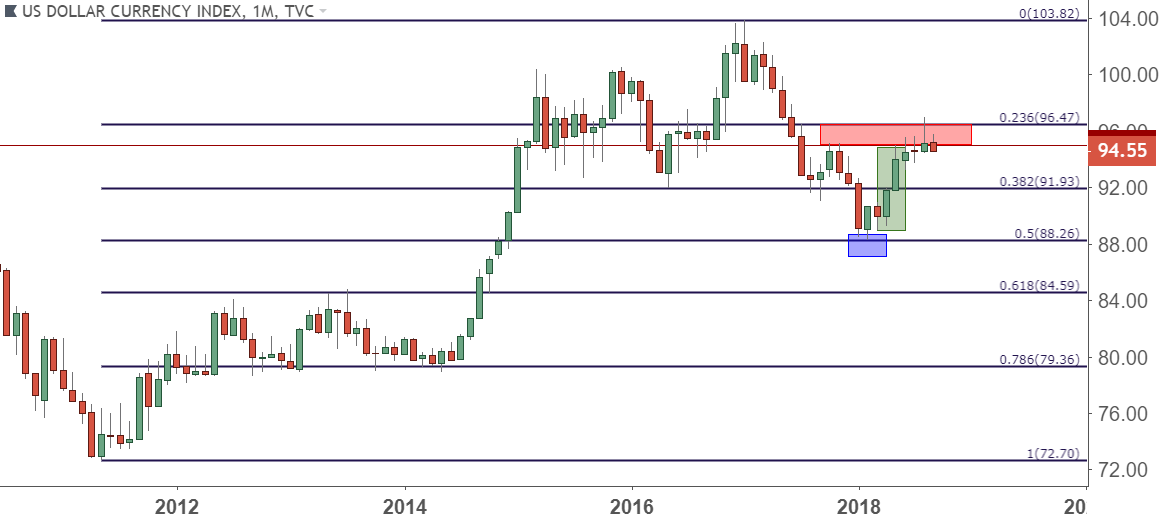
Chart prepared by James Stanley
ECB Brings Little Surprise
In an event that rivaled yesterday’s Apple reveal for being leaked ahead of the presser, the European Central Bank brought few surprises at this morning’s ECB rate decision. The bank announced that they’re going to begin tapering bond purchases next month, set to finish entirely by the end of the year, while also slightly nudging growth forecasts lower.
The single currency largely held up through the rate decision and announcement of stimulus taper. It wasn’t until after the 8:30 press conference began, at which point we already had the US CPI data from August, that EUR/USD began to show notable movement. So, it would be difficult at this point to discern exactly whether Mr. Draghi brought much pressure to the bid in EUR/USD or whether that strength was coming from a weak US Dollar following that inflation release. At this point, however, it does appear as though the US CPI release has had a larger bearing on this morning’s EUR/USD price action.
EUR/USD One-Minute Price Chart
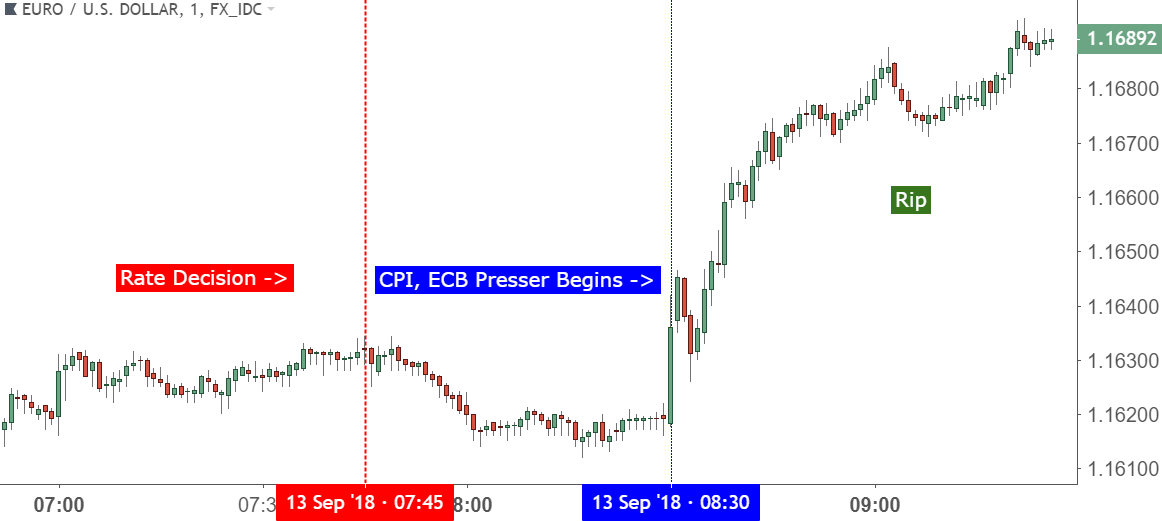
Chart prepared by James Stanley
Regardless of the exact driver, the pair is now fast approaching a key zone of resistance, an area that we’ve been following for much of the past month to demarcate whether or not the bearish trend has any value remaining. This area runs from 1.1709 (the 38.2% Fibonacci retracement of the 2017 up-trend in the pair) up to the late-July swing high at 1.1751, and this helped to hold the August swing highs as prices pushed back down towards 1.1500. But, as we’ve now seen on seven separate occasions since late-May, bulls came-in at support to defend the lows.
EUR/USD Eight-Hour Price Chart: 1.1530 Holds the Low, Prices Re-Approaching Key Resistance
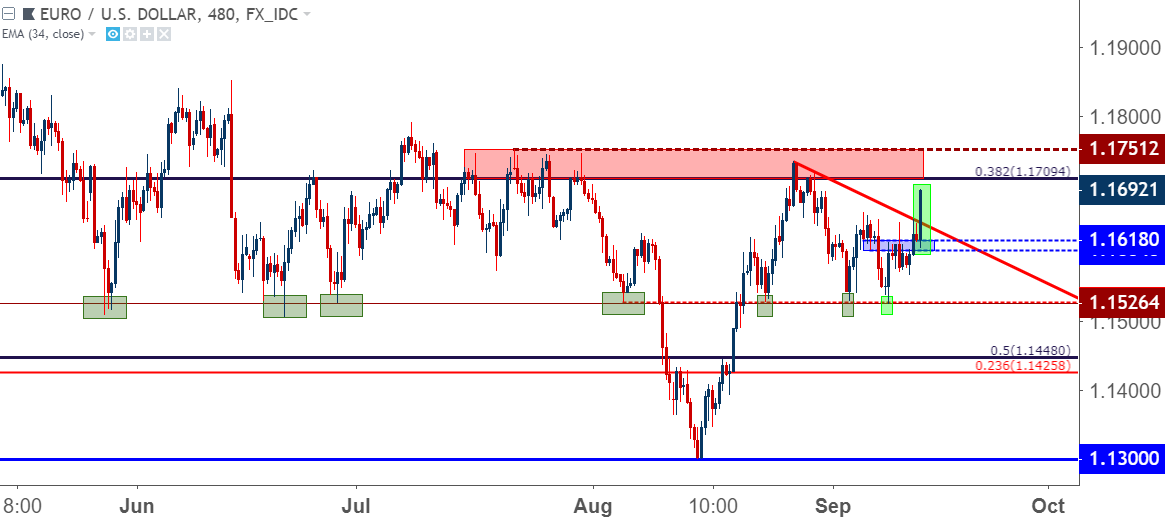
Chart prepared by James Stanley
GBP/USD Surges into Fibonacci Resistance
In a similar move, GBP/USD softened in the immediate aftermath of the Bank of England’s rate decision, which brought few changes or surprises. But, after that US CPI release, bulls came into bid and drove prices all the way up to a fresh six-week high in the pair.
GBP/USD price action is currently seeing a bit of resistance off of the 1.3117 level, which we looked at yesterday. This is the 38.2% retracement of the Brexit move, and this comes from the same study that helped to mark both the April high and the August low in the pair.
GBP/USD Weekly Price Chart
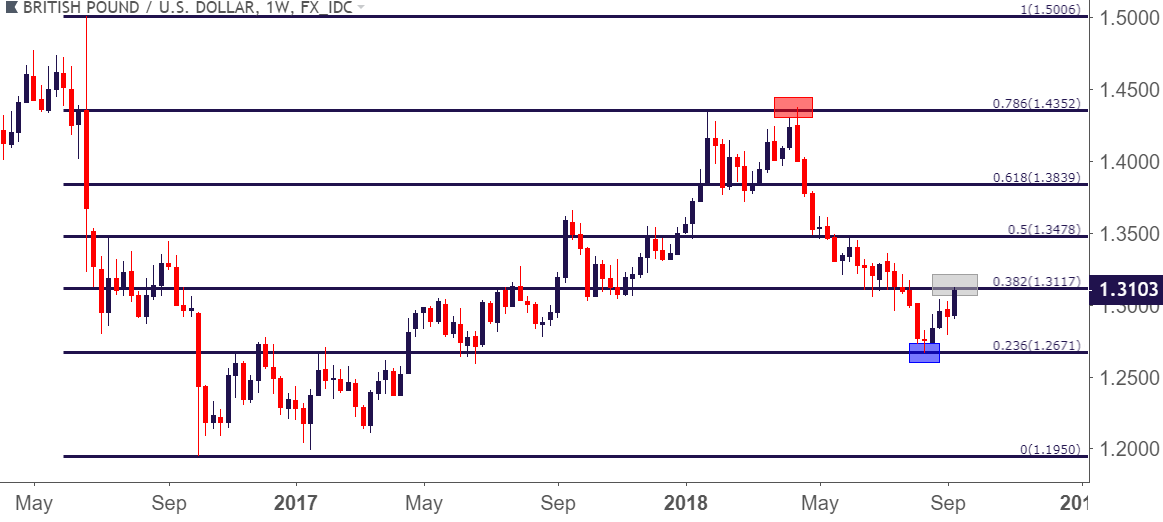
Chart prepared by James Stanley
As we discussed yesterday, a topside test of this level makes the prospect of bullish continuation look a bit more attractive; and this can now open the door for higher-low support.
GBP/USD Four-Hour Price Chart
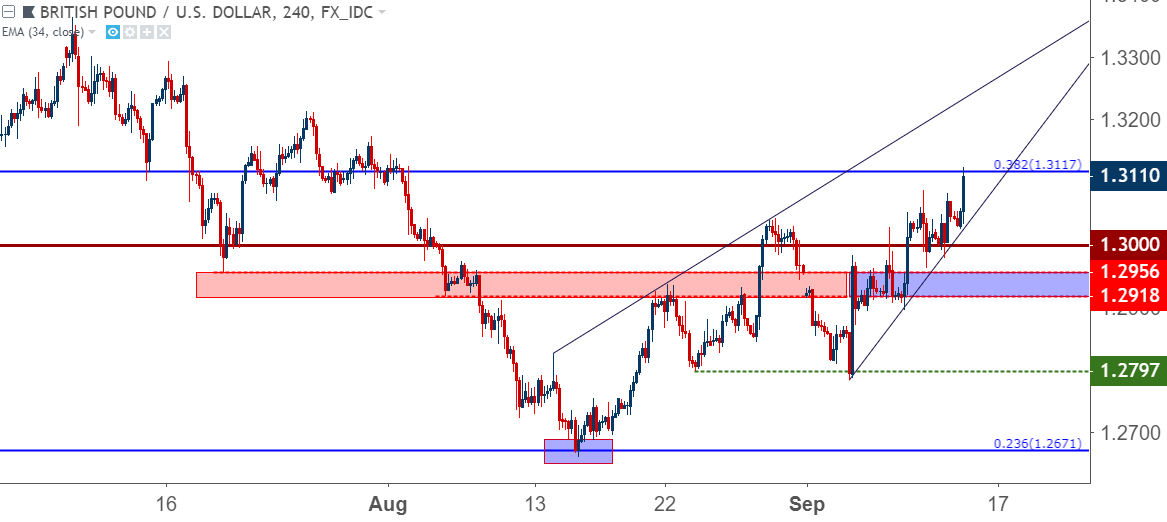
Chart prepared by James Stanley
To read more:
Are you looking for longer-term analysis on the U.S. Dollar? Our DailyFX Forecasts for Q3 have a section for each major currency, and we also offer a plethora of resources on USD-pairs such as EUR/USD, GBP/USD, USD/JPY, AUD/USD. Traders can also stay up with near-term positioning via our IG Client Sentiment Indicator.
Forex Trading Resources
DailyFX offers a plethora of tools, indicators and resources to help traders. For those looking for trading ideas, our IG Client Sentiment shows the positioning of retail traders with actual live trades and positions. Our trading guides bring our DailyFX Quarterly Forecasts and our Top Trading Opportunities; and our real-time news feed has intra-day interactions from the DailyFX team. And if you’re looking for real-time analysis, our DailyFX Webinars offer numerous sessions each week in which you can see how and why we’re looking at what we’re looking at.
If you’re looking for educational information, our New to FX guide is there to help new(er) traders while our Traits of Successful Traders research is built to help sharpen the skill set by focusing on risk and trade management.
--- Written by James Stanley, Strategist for DailyFX.com
Contact and follow James on Twitter: @JStanleyFX


