


Talking Points:
- The US Dollar continues to battle with the 95.00 level, and this most recent test comes with a bit of heightened interest: Last week saw sellers drive below the level only to be followed by buyers pushing off of the August lows into month-end. This came along with a resistance reaction at a big area in EUR/USD. Yesterday saw resistance in USD/DXY at the June and July highs around 95.53, and this adds further questions to the sustainability of US Dollar strength as we move towards the end of Q3.
- Despite the US Dollar’s strong showing over the past four months, the currency is still down by -8.5% from last year’s January high. And the major bulk of that bullish move appears to be driven more by fear and risk aversion than monetary policy. The question remains as to which trend will maintain control of USD price action into year-end: Will it be the bigger-picture bearish drive that dominated FX markets last year? Or will the more recent theme of USD-strength take-control to push the US Dollar to fresh yearly highs?
- DailyFX Forecasts on a variety of currencies such as the US Dollar or the Euro are available from the DailyFX Trading Guides page. If you’re looking to improve your trading approach, check out Traits of Successful Traders. And if you’re looking for an introductory primer to the Forex market, check out our New to FX Guide.
Do you want to see how retail traders are currently trading the US Dollar? Check out our IG Client Sentiment Indicator.
US Dollar Grinds at Support, Can Bulls Hold the Line?
The US Dollar continues to grasp on to support around the 95.00 level, and this comes after another theme of strength earlier in the week flared out after testing 95.53 yesterday. This extends the US Dollar’s three month impasse, as we set the monthly high in May at the same level that’s attempting to hold up support today.
US Dollar Four-Hour Price Chart: Going Nowhere Fast, May Resistance Helping to Set Short-Term Support

Chart prepared by James Stanley
This sets the stage for tomorrow’s Non-Farm Payrolls release, which is the highlight of this week’s economic calendar. The expectation is for 193k jobs to have been added to American payrolls in the month of August, and markets are looking for an unemployment rate at 3.8%. As has become the norm, considerable focus will be paid to the Average Hourly Earnings portion of the report in the effort of seeing early-stage wage growth ahead of the Fed’s expected rate hike later in the month.
DailyFX Economic Calendar: NFP, Canadian Jobs at 8:30 AM ET Tomorrow Morning
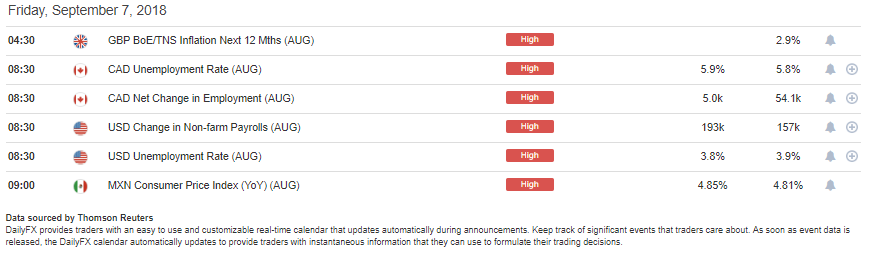
Chart prepared by James Stanley
Today’s support comes with an additional item of interest, as it appears that we have a short-term theme that could trigger into a longer-term scenario. The US Dollar bottomed in February and hit a fresh high in August. But the bulk of this year’s topside move in USD took place in April and May; and after hitting that high at 95.00 in the final days of May, prices have largely been range-bound with a slight upward bias. We look at the monthly chart below to illustrate.
US Dollar Monthly Price Chart: Two Months of Strength, Four Months of Grind at Key Area

Chart prepared by James Stanley
That upward bias has started to come into question after the late-August crush of USD weakness. Prices temporarily tested below a bullish trend-line, and while bulls were able to push back-above, their failure to substantiate any strength above 95.50 highlights the fact that this theme may be nearing over, particularly if we draw back to drivers for that April and May major move: It wasn’t US rate policy, nor did it appear to come from a strong operating backdrop for the US economy. The primary push point for that bullish USD move appeared to emanate from weakness around Europe.
The month of April saw a brutal reversal in the British Pound while the Euro started to dip in the early stages of its own trend reversal. And the month of May saw fresh jitters enter the equation around Italian politics, out of fear that the newly installed government may force a debt standoff with the ECB.
So, deductively, it would appear that the bulk of this year’s topside move in USD is coming from fear and risk aversion rather than monetary policy. And if we do see that fear take more of a backseat, then we may be looking at a re-emergence of the USD weakness that became so commonplace last year.
US Dollar Daily Price Chart: Break of August Lows Opens Door for Bearish USD Themes

Chart prepared by James Stanley
European Stocks Break Lower
Speaking to that fear, it would appear as though we have a bit of uneven distribution at the moment as European stocks have taken a bearish turn while US issues remain at support. We looked into support structure in the Dow Jones yesterday, and futures continue to hold that line as we approach this morning’s US Open. But in Europe, a different tone has started to show…
We looked into the DAX and the FTSE 100 this week in our equity forecast, focusing on bearish themes that began to show last week. In the DAX, prices had wedged below and found resistance on the underside of a bullish trend-line that’s been at work since the first half of 2016. A big support level awaits around the price of 11,727, which is the 38.2% retracement of that same major move. This is also the level that caught the lows in March of this year after the aggressive pullback that started in January and held through July.
DAX Weekly Price Chart (Logarithmic): Fresh Five-Month Lows Heading Towards Key Support
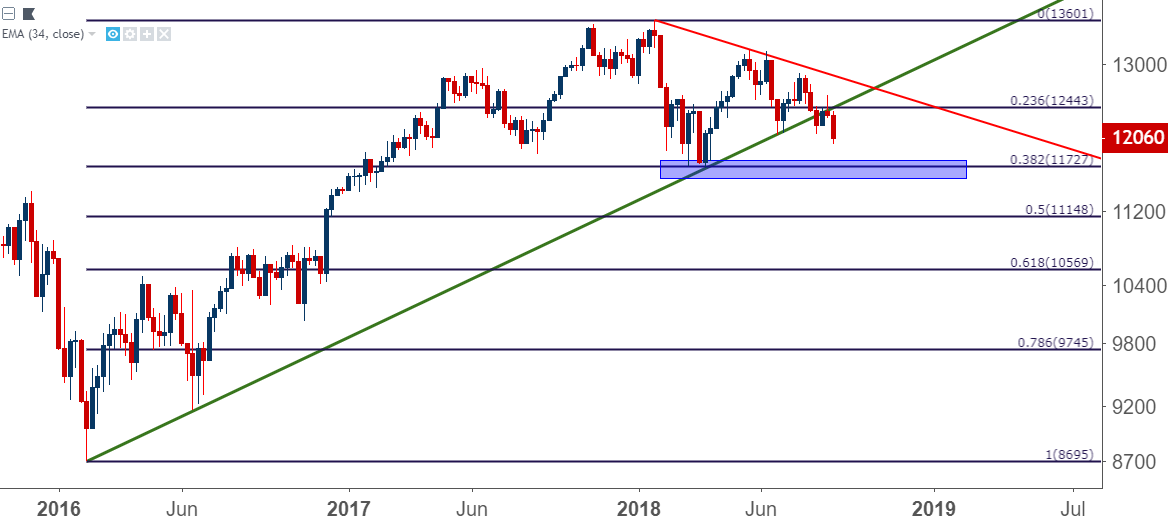
Chart prepared by James Stanley
EUR/USD Back-Above 1.1600
The European currency, on the other hand, appears to have left fear behind. Similar to the US Dollar, the bulk of the recent major move came-in during April and May, with an extension in early-August that was soon faded out of the market. This correlates with those pressure points that have shown around the Euro-Zone of recent as fears around Italian politics drove the selling in May while jitters around Turkey drove the extension of that move in early-August.
EUR/USD held and dropped from a key resistance zone in the closing days of August, but as we looked at yesterday, very similar to what had happened through the first-half of this summer, bears lost motivation ahead of a 1.1500 re-test, and that soon turned into a topside move as buyers began to take-control. There’s even a building bullish case on the hourly chart as prices have worked up to a short-term higher-high, and we’ve seen a bit of support above prior resistance.
EUR/USD Hourly Price Chart

Chart prepared by James Stanley
On a longer-term chart, this places additional emphasis on that big zone of resistance that we’ve been following that runs from 1.1709 up to 1.1750. This is the area that capped the July highs, and this came back into play ahead of the August close.
For traders that do want to look for a longer-term re-emergence of strength in the single currency, this becomes an ideal area to follow for the development of that theme. Bulls overtaking this level and driving up to fresh highs could open the door for an eventual re-test of the 1.2000 level, which we haven’t traded at since April just as those concerns around Italian politics were beginning to get priced-in.
EUR/USD Daily Price Chart: A Big Area of Resistance Ahead
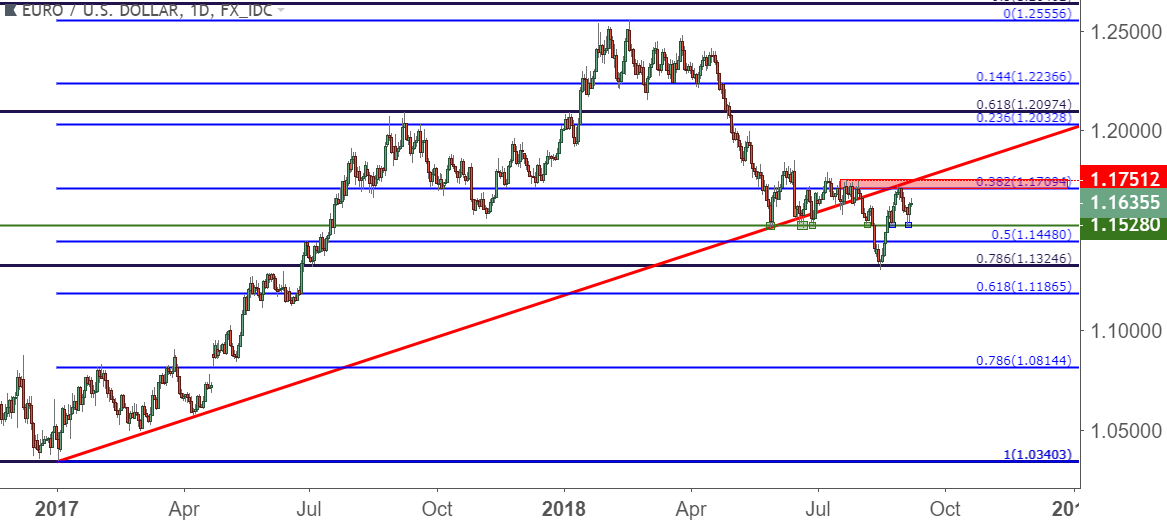
Chart prepared by James Stanley
To read more:
Are you looking for longer-term analysis on the U.S. Dollar? Our DailyFX Forecasts for Q3 have a section for each major currency, and we also offer a plethora of resources on USD-pairs such as EUR/USD, GBP/USD, USD/JPY, AUD/USD. Traders can also stay up with near-term positioning via our IG Client Sentiment Indicator.
Forex Trading Resources
DailyFX offers a plethora of tools, indicators and resources to help traders. For those looking for trading ideas, our IG Client Sentiment shows the positioning of retail traders with actual live trades and positions. Our trading guides bring our DailyFX Quarterly Forecasts and our Top Trading Opportunities; and our real-time news feed has intra-day interactions from the DailyFX team. And if you’re looking for real-time analysis, our DailyFX Webinars offer numerous sessions each week in which you can see how and why we’re looking at what we’re looking at.
If you’re looking for educational information, our New to FX guide is there to help new(er) traders while our Traits of Successful Traders research is built to help sharpen the skill set by focusing on risk and trade management.
--- Written by James Stanley, Strategist for DailyFX.com
Contact and follow James on Twitter: @JStanleyFX


