


Talking Points:
- We’re fast nearing the end of what’s become an eventful month of August, and this marks the end of summer trading as the Labor Day holiday takes place in the United States on Monday. Many US banks will remain closed for the holiday, and the data starts soon after that with an RBA rate decision set for Tuesday morning at 12:30 AM ET. Next week also brings a Bank of Canada rate decision on Wednesday, and with the CAD on the move of recent this should be very interesting. Next week closes with Non-Farm Payrolls on Friday morning.
- The US Dollar is in a very interesting spot as we wind down a very volatile month of August. The first half of the period was marked by considerable strength. USD soon found resistance at our first target from the Q3 Technical Forecast, at which point a pullback began that erased the entirety of those prior August gains. After a build of support at the monthly lows over the past few days, prices are now testing the key 95.00 level as we close-down the month. Below, we look at a bullish case around the US Dollar in bearish setups in EUR/USD; while entertaining the potential for deeper USD-weakness with GBP/USD.
- DailyFX Forecasts on a variety of currencies such as the US Dollar or the Euro are available from the DailyFX Trading Guides page. If you’re looking to improve your trading approach, check out Traits of Successful Traders. And if you’re looking for an introductory primer to the Forex market, check out our New to FX Guide.
Do you want to see how retail traders are currently trading the US Dollar? Check out our IG Client Sentiment Indicator.
US Dollar Primed as September Nears
We are now winding down what’s become an eventful month of August. While August is commonly slow across financial markets as the summer season winds down, this year has seen heightened activity throughout the month, capping what’s been a fairly atypical summer. U S equities have run-up to fresh highs over the past month, and both the US Dollar and the Euro have remained on the move which has kept Foreign Exchange traders busy across a wide swath of currency pairs.
This weekend marks the end of summer trading as we have the Labor Day holiday in the United States on Monday, which is generally seen as the marker for the end of the season and a return of liquidity as traders return to their desks from the summer holiday. While many US banks will be closed on Monday, next week’s economic calendar picks up a bit as we have a number of important themes in the spotlight. On top of this, we have considerable potential for headline-driven volatility, as a number of themes remain at the forefront of global markets. Below, we’re going to take a deeper-dive into EUR/USD and GBP/USD in order to investigate themes with potential on either side of the US Dollar.
Before we get to that, we look at next week’s economic calendar. We have high-impact data each day of the week from Tuesday-Friday following the Labor Day holiday. An RBA rate decision kicks off the outlay at 12:30 AM on Tuesday morning, and this leads into a Bank of Canada rate decision on Wednesday morning at 10 AM. The week closes with Non-Farm Payrolls and Canadian employment numbers, each of which can continue to carry pull across a wide swath of related markets.
DailyFX Economic Calendar: High-Impact Events for the Week of September 3, 2018
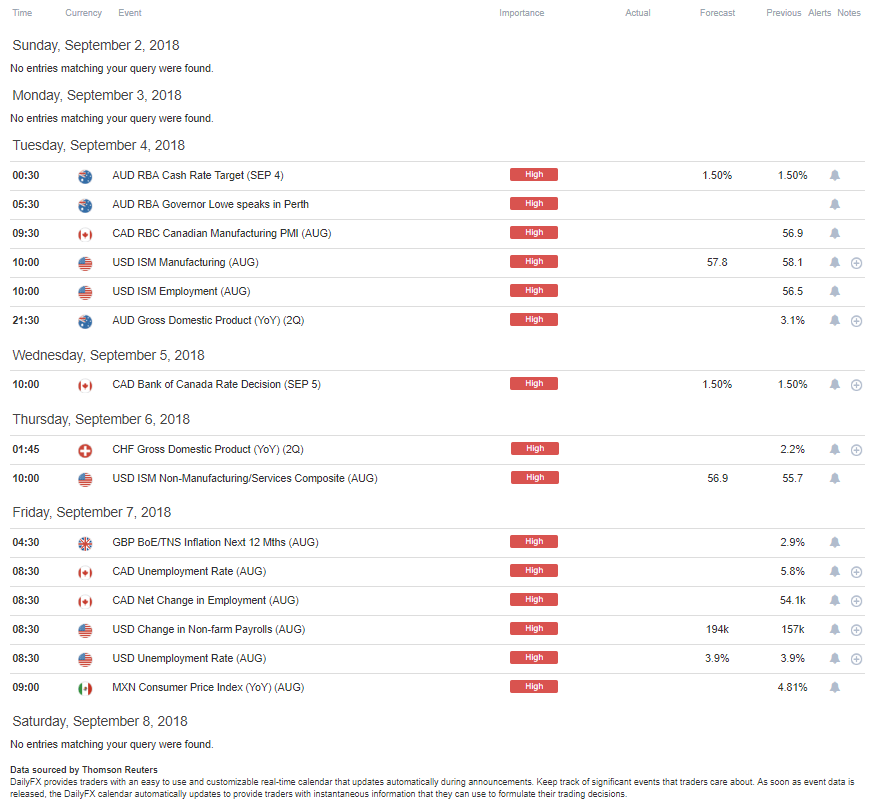
Chart prepared by James Stanley
EUR/USD: Bullish 2017 or Q2 Bearish Reversal?
It’s been a daunting month for the Greenback as the Q2 bullish reversal has come into question, and this has had a large bearing on EUR/USD price action.
While the US currency was on the move throughout 2017, this very much came at odds with the monetary backdrop at the time. The Dollar was continuing to drop despite the fact that the Fed was pretty much the only game in town for rate hikes. EUR/USD was surging throughout the year as the ECB remained loose and dovish: Even the extension of their QE program that was announced in October of last year couldn’t reverse that trend, as it brought a mere two weeks of pullback before buyers jumped back-in to push prices up to fresh highs.
So – if monetary policy wasn’t the primary driver of this change in Q2 – what was?
Judging by price action, the change is fear. The big move-lower in the Euro showed up in May, and this is when the prospect of volatility from Italian politics began to grow more prominent. After a strong impulsive move through the month, EUR/USD set support above 1.1500, and that held for the next two months – even as the ECB said that rates would stay at current levels ‘at least through the summer of 2019.’ So – even that dovish ECB announcement in June couldn’t take out support.
What did ultimately push prices to fresh lows in the Euro were fears around exposure to Turkey. This became of concern in the first-half of August, and this is what finally helped to drive the Euro below 1.1500. Support eventually set-in around 1.1300, and the past two weeks saw a retracement take place until prices finally found resistance around the July swing-highs. This was the last zone of resistance we were looking at to keep the door open for bearish strategies in the pair, and that came into play throughout this week as price action posed a grind, and then a drop from key resistance.
EUR/USD Four-Hour Price Chart: V-Shaped Reversal Finds Resistance at Key Zone

On a longer-term basis, EUR/USD put in a reaction from a very interesting spot on the chart, and this can keep interest revolving around the short-side of the pair as we move into September. As we discussed in this week’s FX Setups, overtaking this area would be a key variable for top-side approaches in the pair as we closed out the month. That didn’t happen, prices held at resistance through this week and this keeps the door open for additional down-side in the Euro, particularly as themes around Italian politics and Turkish economics appear to be in the headlines for the foreseeable future.
EUR/USD Daily Price Chart

Chart prepared by James Stanley
The US Dollar: 2017 Weakness or Q2 Bullish Reversal?
Given our current backdrop, it’s almost as if the US Dollar has merely been taking a ride for the past few months and, perhaps even bigger picture the past year-and-a-half. It’s almost ironic to think that coming into 2017 the prospect of ‘too much’ USD strength was being considered a problem. But after the election of President Trump, US assets were on a rip-roaring run that lasted into the start of 2017, with both stocks and the US Dollar surging at the same time.
That didn’t last for too long, however, as a quick turnaround in the Greenback in January of 2017 showed up, and that pretty much lasted into February of this year. That’s around the time that an interesting support level came into play at 88.26. This is the 50% marker from the 2011-2017 major move in USD, and once this price was hit in February, the low was set and the down-trend cooled as we then saw two months of digestion leading into Q2.
US Dollar Monthly Price Chart: February Support at 50% of 2011-2017 Major Move
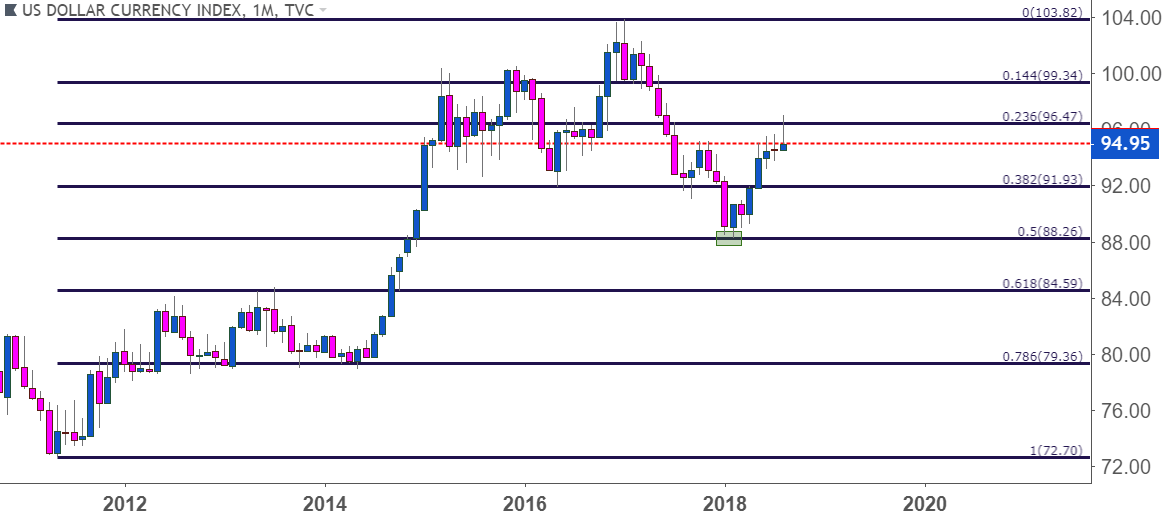
Chart prepared by James Stanley
That support held the lows in the Dollar from February and into April. But bulls still had a difficult time kicking it into gear, even despite a March rate hike out of the FOMC. What did finally ignite the fire was the move that was seen in the month of May, as Italian politics all-of-the-sudden became more risky, and the prospect of a debt-standoff between the ECB and the newly installed Italian legislature started to look more likely. This pushed prices in EUR/USD through the month of May, and this is when the topside move in USD was really prominent.
You might notice on the above chart – a red line drawn at the level of 95.00. This was the high water-mark in the month of May. Bulls simply couldn’t take it out. And today, four full months later – that level remains as resistance. We’ve seen numerous tests above this price, even a run-up to the 23.6% Fibonacci retracement of that same move, which was the first target from our Q3 Technical Forecast on USD. But to date – we haven’t yet seen a monthly close above 95.00 on DXY.
As we come into this morning, the US Dollar is threatening to make August the first month in which that happens. Short-term resistance is continuing to show around prior support at 95.00, but we’ve seen a respectable build of support from the August lows around 94.50. If we do see USD close above this level on a monthly basis for the first time in 2018, that could be construed as bullish as we move into September.
US Dollar Four-Hour Price Chart

Chart prepared by James Stanley
GBP/USD: Will Bulls Return After Four-Month Hiatus?
Coming into April, the British Pound had staged a spate of strength against the US Dollar that lasted for more than a year. And with very realistic odds of a rate hike in May, the bid remained strong as buyers pushed ahead.
But that backdrop began to deteriorate in the middle of the month, and by the beginning of May, GBP/USD had sunk down to the 1.3500 level. This was very much driven by an unexpected drop in inflation, which compelled the Bank of England to back away from that May rate hike. As this happened, GBP/USD merely sat on 1.3500; but it was a couple weeks later as the backdrop around Brexit began to get more murky that bears finally grabbed ahold of the British Pound. The summer saw fears of Hard Brexit or a No-Deal Brexit continue to push the Pound lower, and this lasted all the way into two weeks ago.
That’s the point where some big support began to show as taken from the 23.6% Fibonacci retracement of the ‘Brexit move’ in the pair. This is the same study from which the 78.6% marker helped to call the top in April, and after this support began to show in the middle of August, we began to look for top-side counter-trend plays in the pair.
GBP/USD Weekly Price Chart: January, April Resistance at 78.6, August Support at 23.6
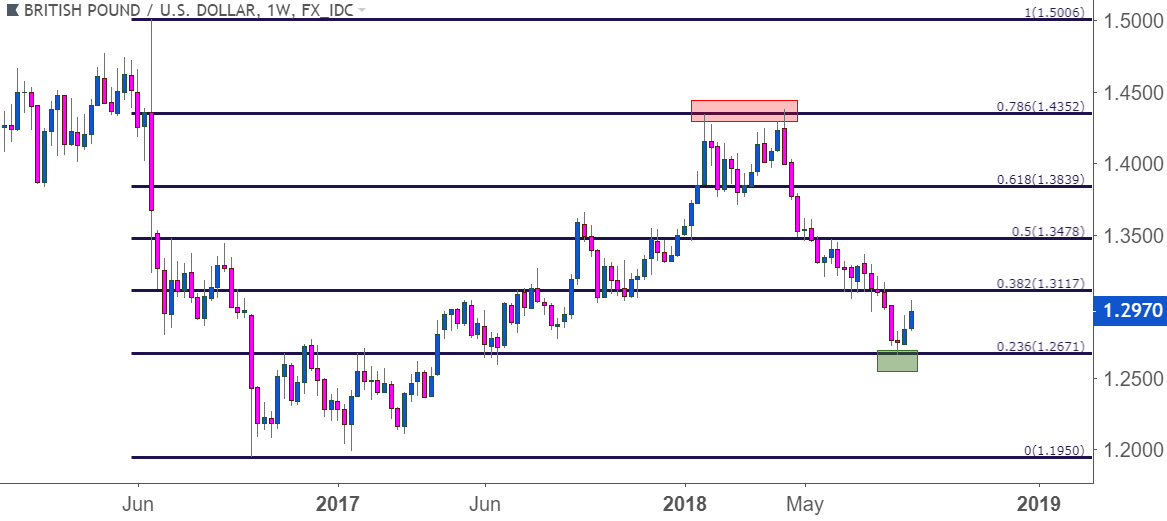
Chart prepared by James Stanley
Over the past four months , it’s become clear that the upcoming Brexit negotiations between the EU and the UK have been a big driver to the currency, perhaps even more so than the Bank of England, as it’s largely expected that the BoE will alter their stance based on Brexit proceedings. A Hard-Brexit or No-Deal Brexit bring downside risk to the currency, while that threat receding can bring the opposite as a bit of pressure is removed from price action.
This happened earlier this week as the EU’s Chief Negotiator announced that the EU would be open to a post-Brexit partnership with the UK. GBP quickly popped-higher as Hard-Brexit risk started to get priced out, and we soon saw GBP/USD testing resistance at the 1.3043 area.
GBP/USD Hourly Price Chart: Cable Pop to Higher-High After Barnier Comments
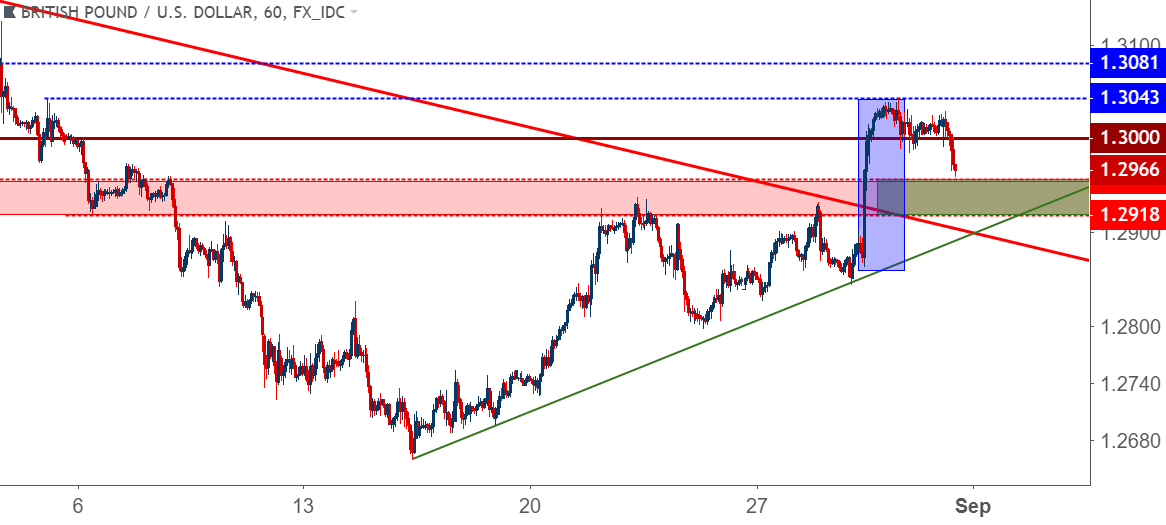
Chart prepared by James Stanley
At this stage, the prospect of bullish continuation remains. The key will be for buyer support to show ahead of the prior swing-low, which took place at 1.2844. In our technical piece on the matter published on Wednesday, we discussed the prospect of using prior resistance as fresh support for plays of bullish continuation. This zone runs from 1.2918 up to 1.2956, and this remains a workable thesis as we move towards the September open.
GBP/USD Four-Hour Price Chart: Support Potential Around Prior Resistance
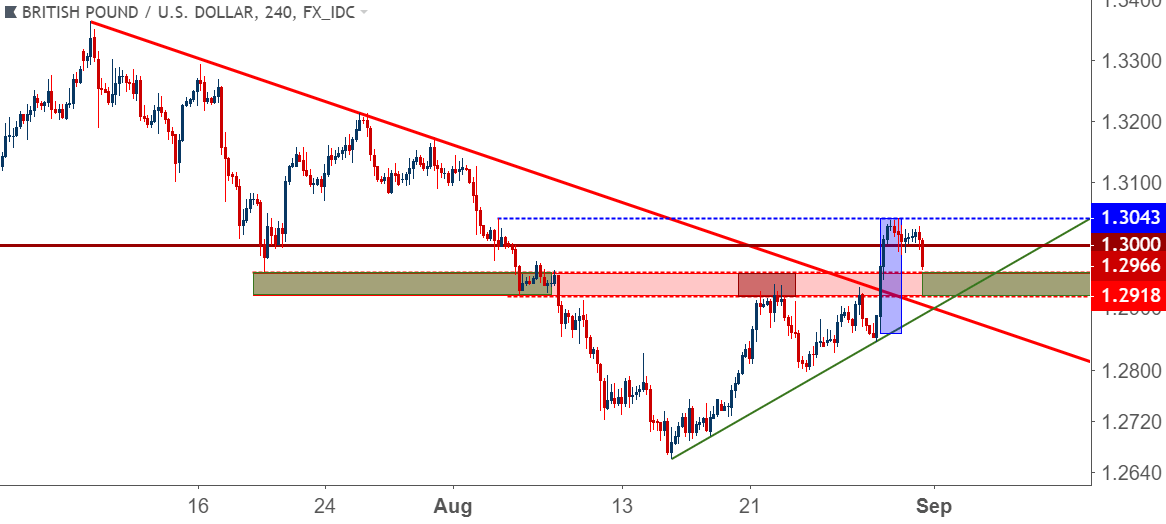
Chart prepared by James Stanley
To read more:
Are you looking for longer-term analysis on the U.S. Dollar? Our DailyFX Forecasts for Q3 have a section for each major currency, and we also offer a plethora of resources on USD-pairs such as EUR/USD, GBP/USD, USD/JPY, AUD/USD. Traders can also stay up with near-term positioning via our IG Client Sentiment Indicator.
Forex Trading Resources
DailyFX offers a plethora of tools, indicators and resources to help traders. For those looking for trading ideas, our IG Client Sentiment shows the positioning of retail traders with actual live trades and positions. Our trading guides bring our DailyFX Quarterly Forecasts and our Top Trading Opportunities; and our real-time news feed has intra-day interactions from the DailyFX team. And if you’re looking for real-time analysis, our DailyFX Webinars offer numerous sessions each week in which you can see how and why we’re looking at what we’re looking at.
If you’re looking for educational information, our New to FX guide is there to help new(er) traders while our Traits of Successful Traders research is built to help sharpen the skill set by focusing on risk and trade management.
--- Written by James Stanley, Strategist for DailyFX.com
Contact and follow James on Twitter: @JStanleyFX


