


Talking Points:
- The US Dollar has fallen-below the bullish trend-line that has supported prices over the past two months, and we’re now seeing sellers test August lows in the currency around 94.50. The big driver here appears to be the recovery in EUR/USD, as the pair has now recovered the entirety of the prior August losses, and then some. The non-completed monthly bar in EUR/USD is now showing a hammer formation, and this can often be looked at for bullish reversals after seller capitulation after a fresh low.
- While EUR/USD has had a very strong second-half of August, the same can’t quite be said for other major pairs, such as GBP/USD and AUD/USD, each of which retain some element of bearish quality on the charts. We look into each of these markets below in the effort of contrasting price action while showing where the big source of USD strength has been emanating from.
- DailyFX Forecasts on a variety of currencies such as the US Dollar or the Euro are available from the DailyFX Trading Guides page. If you’re looking to improve your trading approach, check out Traits of Successful Traders. And if you’re looking for an introductory primer to the Forex market, check out our New to FX Guide.
Do you want to see how retail traders are currently trading the US Dollar? Check out our IG Client Sentiment Indicator.
US Dollar Drops Through Trend-Line Support
The US Dollar has continued its two week descent, and this comes just after the Greenback set a fresh yearly high in the middle of August. It’s been a quick retracement in USD and as we looked at yesterday, prices were previously sitting on a big support level around the 95.00 handle on DXY. This wasn’t the first time that support came into play, as we’d seen something similar show in early-August. But during that run, the Euro caught another wave of selling as fears around contagion from Turkey pushed the single currency lower, driving EUR/USD along with it. This is what helped DXY breakout to that fresh yearly high two weeks ago; and as EUR/USD has recovered, DXY has retraced.
But elsewhere, in pairs such as GBP/USD and AUD/USD, the question remains whether the bullish trend in the US Dollar is dead and gone or whether we’ve just pulled back and reloaded for another run of continuation. Below, we look through three major currency pairs to investigate this deviation and where traders may be best served looking for US Dollar weakness to show with a bit more prominence, or which markets may be best positioned for a return of US Dollar strength.
The US Dollar Drops Through Trend-line Support
After a very bullish first half of August the US currency is undergoing quite the reversal in the second-half of the month, with DXY having topped-out on August 15th. Perhaps most interesting in DXY are the support levels that have been taken-out in the process, as a big zone of prior resistance put in a week of attempted support until that area was taken-out over the past two trading days. A bit-lower, we have potential support at 94.50 (the August swing-low), 94.27 and 94.02. For those looking for USD-weakness, these support levels can be used to look for bounces up to short-term resistance to sell into the move.
US Dollar Daily Price Chart
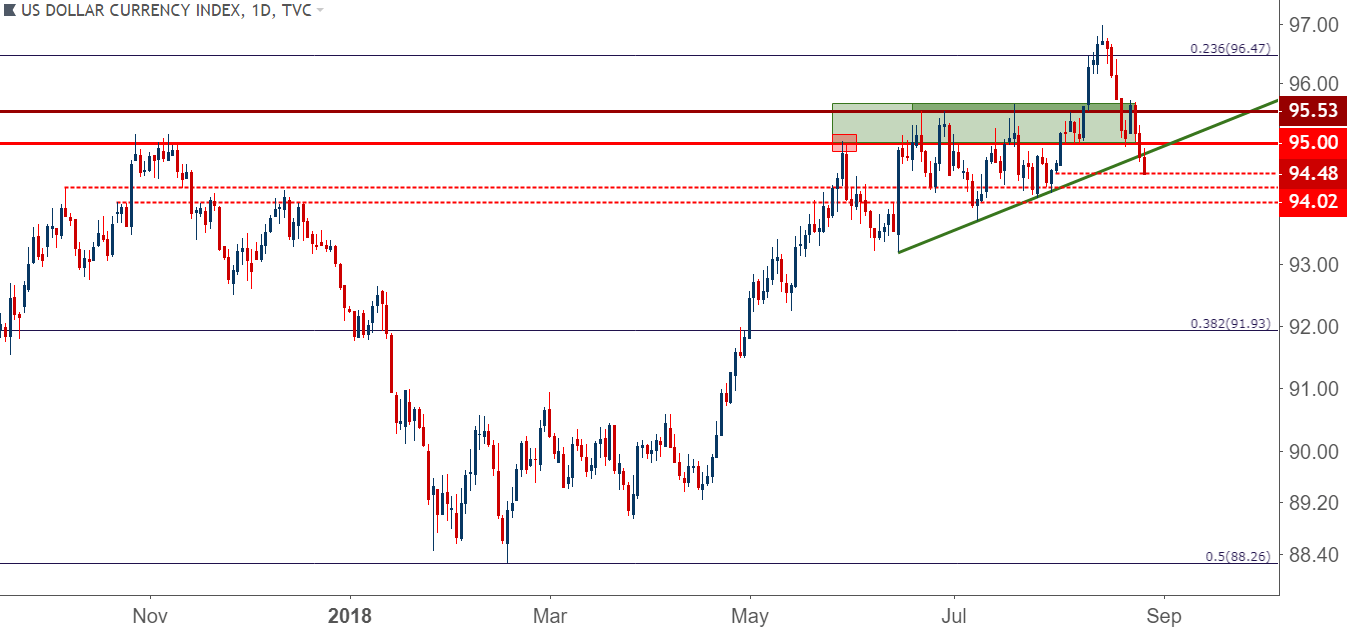
Chart prepared by James Stanley
On shorter-term charts, there is still no evidence that DXY has bottomed out. Price action is still making lower-lows and lower-highs, indicating potential for continuation. For those that do want to sell the Dollar, the potential for resistance at prior support, around the 95.00 level can keep that door open for such. If prices move up to this zone and finds sellers, as can be indicated with topside wicks on hourly or four-hour candles to indicate intra-bar reaction, short strategies could become attractive for traders looking to take USD down to a deeper support level.
For those that continue to carry a bullish USD bias, whether it’s on DXY or a related pair, waiting for DXY to re-break above this level could be an initial barrier to re-employing bullish USD strategies.
US Dollar Hourly Price Chart: Resistance Potential at Prior Support
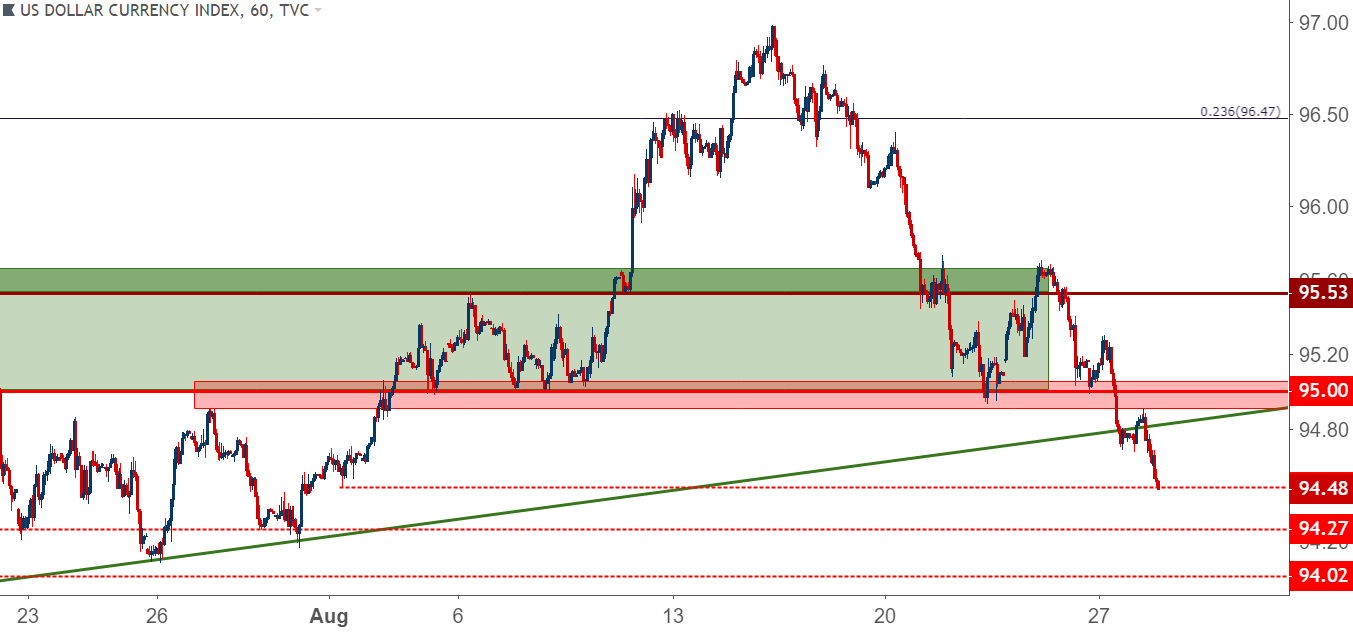
Chart prepared by James Stanley
Euro Recovery Continues After Earlier-August Breakdown
If there’s been one noteworthy driver of this month’s move in the US Dollar, it’s coming from the Euro. While the single currency came into August selling-off on fear of contagion, the second half of the month has been marked by a strong recovery that’s seen prices erase the entirety of those prior losses.
EUR/USD is now more than 400 pips above the prior low, and prices are testing a key area on the chart at 1.1709. This is the 38.2% Fibonacci retracement of the 2017 bullish up-trend in the pair, and this level had previously helped to form a zone of resistance ahead of the bearish move that kicked prices down to that August low. In this week’s FX Setups of the Week, we looked at the area from this Fibonacci retracement up to 1.1750 being somewhat of the last stop of resistance potential for short-side approaches.
EUR/USD Eight-Hour Price Chart: Fresh August Highs, Begins Test of Prior July Resistance Zone
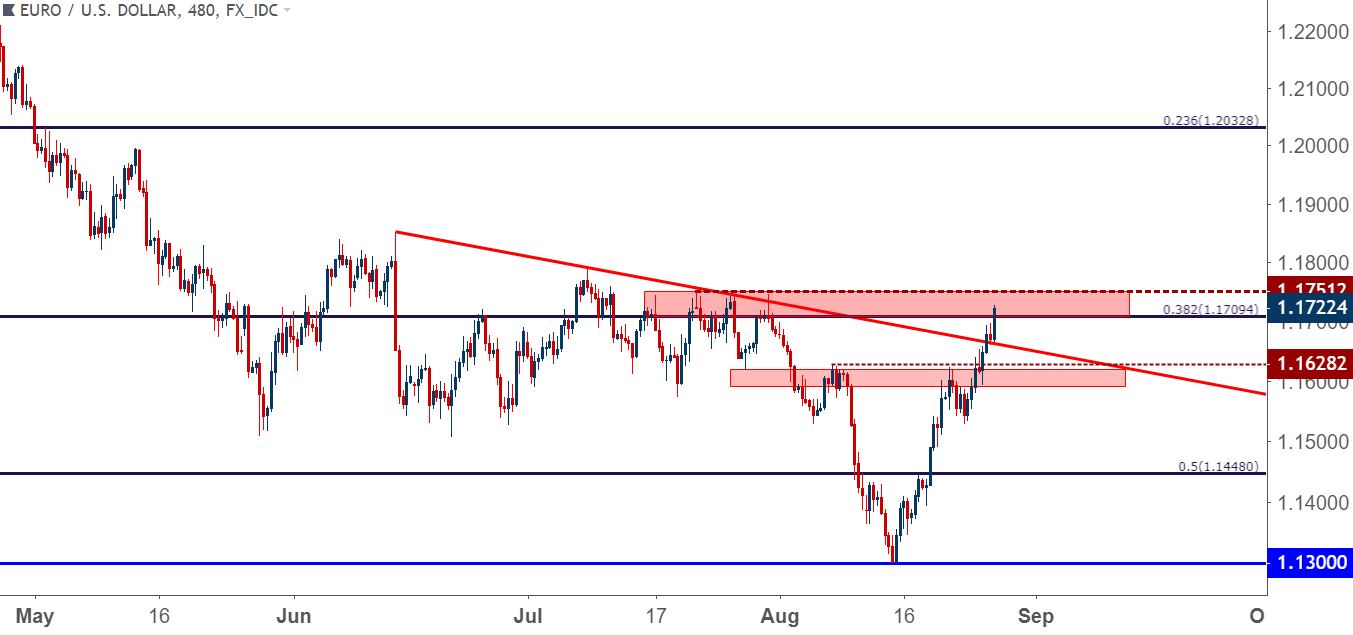
Chart prepared by James Stanley
Given the August move in the pair, the monthly chart is shaping up to be quite interesting here, particularly if we get some continued strength as we trade into month-end. After bouncing from the 78.6% retracement of the 2011-2017 bearish move in the pair, prices erased the entirety of that earlier-month sell-off and then some. At this point, the non-completed August monthly bar is showing a hammer formation, which can be interesting for bullish reversals after a failed attempt at support.
EUR/USD Monthly Price Chart: Non-Completed Hammer Formation Building
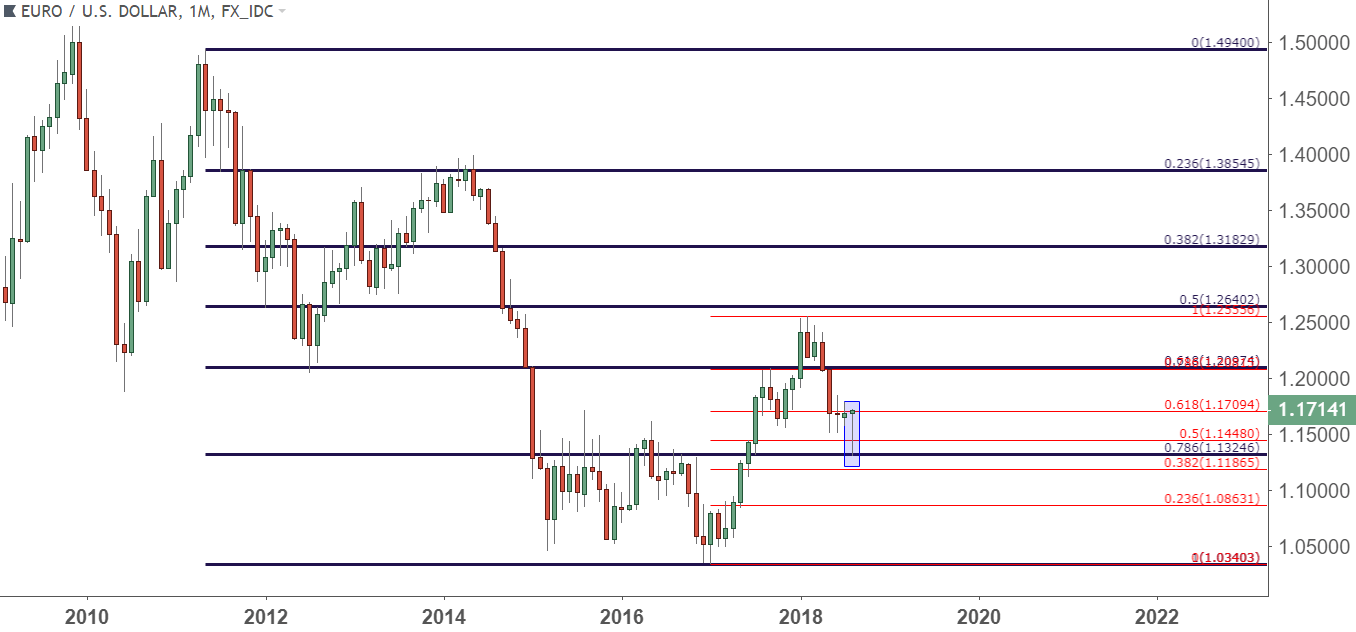
Chart prepared by James Stanley
If we do see continued strength in the pair (with prices moving above 1.1750) while that formation fills in, traders would likely want to approach the pair in a bullish manner moving forward. This wouldn’t mean a direct buy at 1.1750, but rather letting that level open the door to the bullish approach, at which point the trader can wait for higher low support around prior points of resistance, looking to trade for trend continuation in a risk-conscious manner.
GBP/USD
While that recovery in EUR/USD has been pronounced, what’s been showing in GBP/USD has shown less enthusiasm. While we saw a similar support bounce in the middle of August, the bullish follow-thru has been more moderate as prices remain well-below their prior August highs. Price action is now entering a zone of prior resistance that we’d previously used for topside targets, and this takes place within a building symmetrical wedge pattern that indicates digestion after a one-sided move.
GBP/USD Four-Hour Price Chart
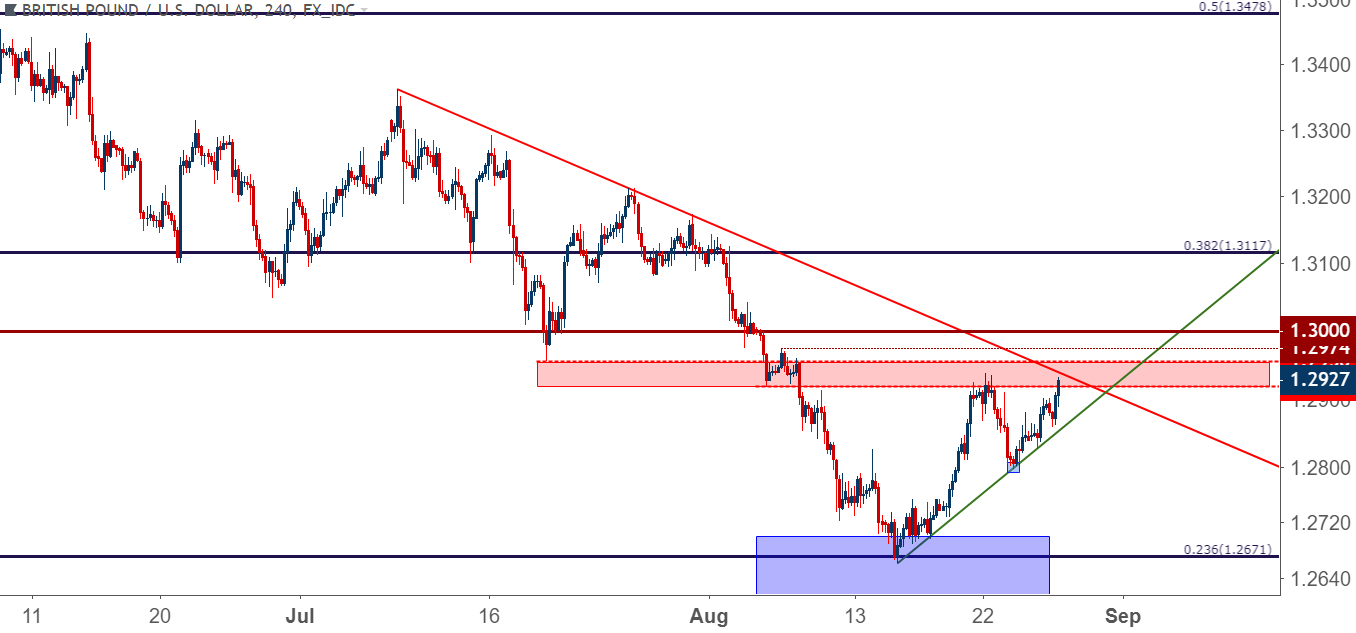
Chart prepared by James Stanley
For traders that do want to look for US Dollar strength to come back, this would likely be a more attractive area to do so with our current backdrop than what we looked at above in EUR/USD. We looked at this setup as part of our FX Setups for This Week. The fact that prices remain within proximity of recent resistance, at the very least, can allow for cogent risk management. The level of importance for longer-term trend here appears to be around the 1.3000 area. This had helped to hold support ahead of the earlier-August breakdown, and that bearish break took place around the BoE rate hike earlier in the month.
GBP/USD Daily Price Chart: Fibonacci Support Bounce Leads to Test of Lower-High Resistance
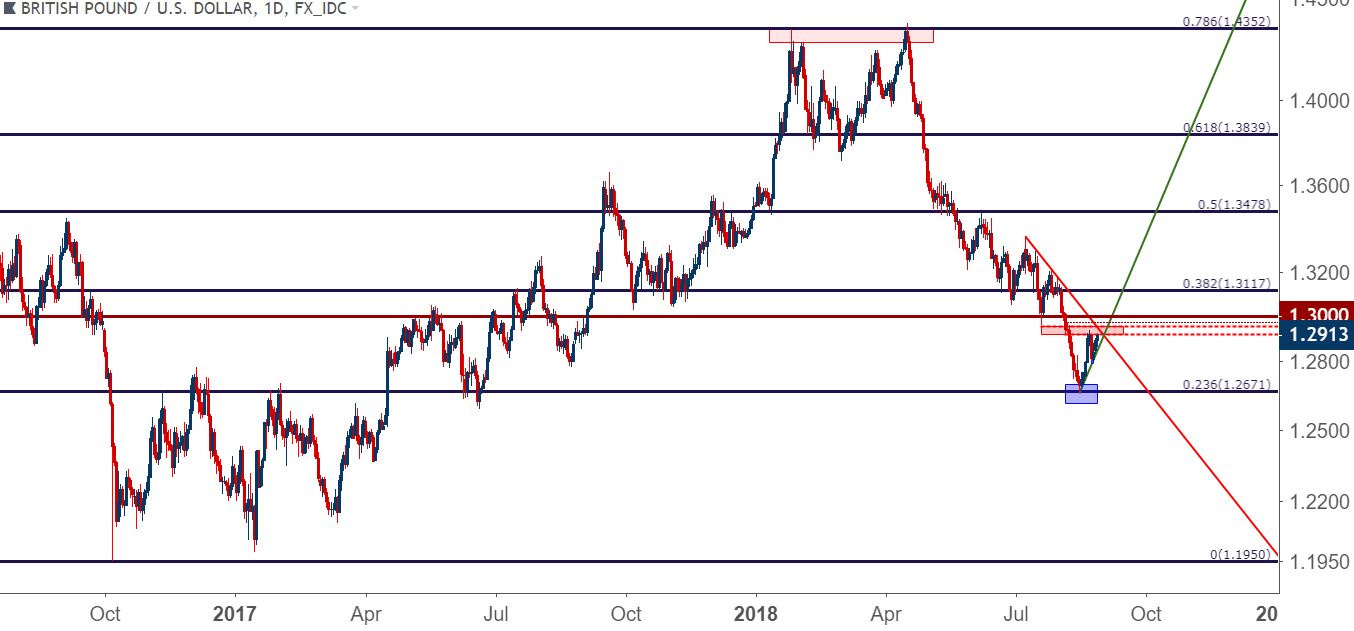
Chart prepared by James Stanley
AUD/USD Bounce From Confluent Support
Another pair of interest for long-USD strategies is AUD/USD. Similar to the above two majors markets, AUD/USD intersected with a big support zone in the middle of this month. In AUD/USD, this came from the .7200 area on the chart as prices re-tested a confluent zone of support that last came into play in January of 2017.
AUD/USD Weekly Price Chart: Bounce From Confluent Support

Chart prepared by James Stanley
We used that support area earlier in the month to look for counter-trend setups in the pair, and while that bounce from support has largely held, bulls haven’t appeared overly-enthusiastic as prices came back to re-test resistance. At this stage, AUD/USD price action remains mired in the 2018 downtrend as defined by the bearish trend-line below, and this can keep the door open for short-side strategies, particularly from those that are looking to trade a return of US Dollar strength.
AUD/USD Daily Price Chart: The 2018 Down-Trend Remains After Confluent Support Bounce
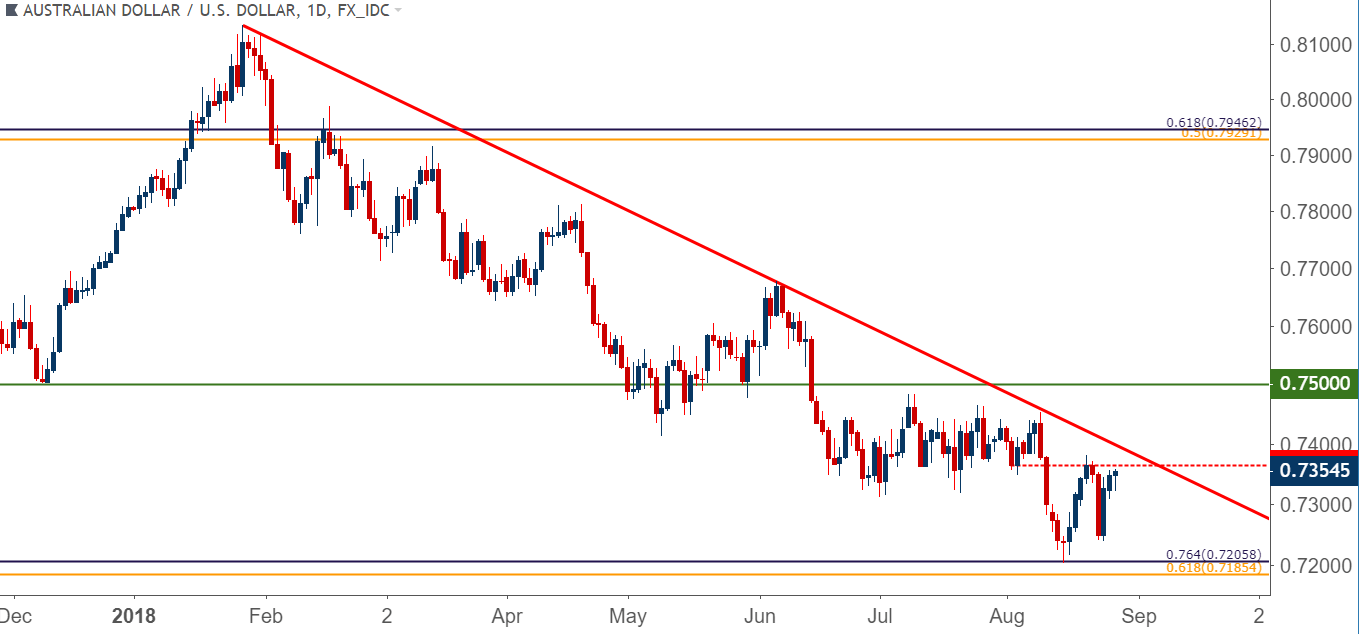
Chart prepared by James Stanley
To read more:
Are you looking for longer-term analysis on the U.S. Dollar? Our DailyFX Forecasts for Q3 have a section for each major currency, and we also offer a plethora of resources on USD-pairs such as EUR/USD, GBP/USD, USD/JPY, AUD/USD. Traders can also stay up with near-term positioning via our IG Client Sentiment Indicator.
Forex Trading Resources
DailyFX offers a plethora of tools, indicators and resources to help traders. For those looking for trading ideas, our IG Client Sentiment shows the positioning of retail traders with actual live trades and positions. Our trading guides bring our DailyFX Quarterly Forecasts and our Top Trading Opportunities; and our real-time news feed has intra-day interactions from the DailyFX team. And if you’re looking for real-time analysis, our DailyFX Webinars offer numerous sessions each week in which you can see how and why we’re looking at what we’re looking at.
If you’re looking for educational information, our New to FX guide is there to help new(er) traders while our Traits of Successful Traders research is built to help sharpen the skill set by focusing on risk and trade management.
--- Written by James Stanley, Strategist for DailyFX.com
Contact and follow James on Twitter: @JStanleyFX


