


Talking Points:
- The US Dollar pullback is now entering its fifth day after finding resistance last Wednesday. The past five days have seen a rather vigorous retracement push prices right back down to support after last week’s breakout, and after yesterday saw the topside of the zone being tested, today finds a deeper retracement now moving towards the bottom portion of the area. Will bulls come back to continue the four-month up-trend? Or are we sitting on the cusp of a return of the bearish price action that dominated the currency’s 2017 performance?
- Coming into this week we looked at setups in major pairs of EUR/USD, GBP/USD and AUD/USD, all of which have rallied as the USD sell-off has continued. But which pairs are best positioned for a return of USD-strength, and which might be most amenable should a bigger-picture US Dollar reversal begin to show? FOMC minutes are set to be released later today, and ECB meeting minutes are due to be published tomorrow morning: This can keep EUR/USD in the spotlight over the next 24 hours as bulls continue to claw back prior losses.
- DailyFX Forecasts on a variety of currencies such as the US Dollar or the Euro are available from the DailyFX Trading Guides page. If you’re looking to improve your trading approach, check out Traits of Successful Traders. And if you’re looking for an introductory primer to the Forex market, check out our New to FX Guide.
Do you want to see how retail traders are currently trading the US Dollar? Check out our IG Client Sentiment Indicator.
US Dollar Pullback Continues as Greenback Drops Deeper into Support
The pullback in the US Dollar is now entering its fifth day, and this comes after a rather strong topside advance to start the month of August. But after topping out last Wednesday, price action has fallen back just as quickly as it had previously jumped, and we’re now nearing the August low in the currency that was set on the first trading day of the month at the price of 94.49.
At this stage, we’re testing the 95.00 level in DXY, and this was the swing-high from the month of May. This is also towards the bottom portion of the support zone that we were looking at yesterday, with subordinated support a bit lower on the chart, taken from the bullish trend-line projection that’s held the lows in the currency for the past two months; most recently helping to set the swing-low ahead of the August bullish breakout.
US Dollar Four-Hour Price Chart: Deeper Drop into Support, Can the Bullish Trend-Line Hold the Lows?

Chart prepared by James Stanley
The big question at this point is whether the Greenback has topped out. The pace with which this pullback has shown already has many looking for a return of US Dollar weakness after the past four months of strength. But, at this stage, we’re testing the 23.6% Fibonacci retracement of the move that started in mid-April, and it would be far too early to call the bullish theme in the US Dollar over for good. A break through short-term support would make those prospects a bit more attractive, but it’s important to keep in mind that we have a mere five days of weakness after four months of strength.
US Dollar Daily Price Chart

Chart prepared by James Stanley
What Could Make USD Bearish?
Going back to the pace with which the declines have come in, the weekly chart of USD may be soon opening the door to bearish strategies.
Last week produced a shooting star formation (think single candle inverted hammer formation, only with a bearish candle body) at the top of US Dollar price action, and the reaction (wick) took place around a key resistance level of 96.47. This is the 23.6% retracement of the same Fibonacci study that helped to mark the 2018 low in USD back in February; and that resistance from last week has continued to play out into this week with prices continuing to move-lower. At this point, we have a non-completed evening star formation in the process of being built on the weekly chart. This is the type of formation that can be interesting for a bearish reversal of the longer-term theme in the US Dollar, looking for a return of the bearish price action that dominated the currency’s 2017 behavior.
If this formation continues to hold as we move into week-end, particularly if it’s coupled with a break of short-term supports, the prospect of a deeper USD sell-off can become significantly more attractive.
US Dollar Weekly Price Chart: Non-Completed Reversal Formation at Fibonacci Resistance
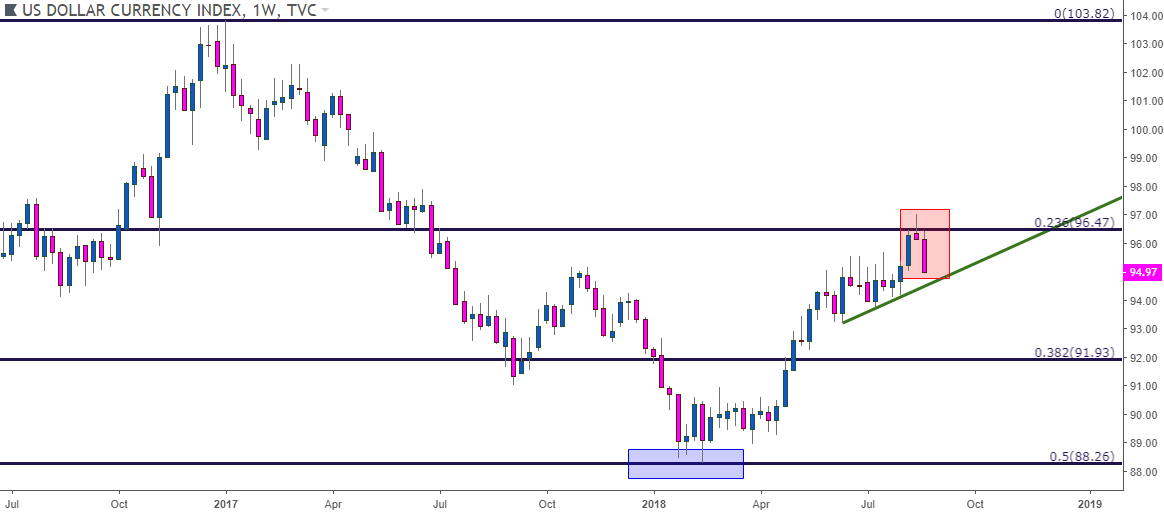
Chart prepared by James Stanley
EUR/USD Begins Test of Resistance at August Highs
Going along with that continued drop in the US Dollar we have a topside rally in EUR/USD that has just crossed 300 pips. The pair set a fresh low just last Wednesday at the price of 1.1300, and what first started as shorts getting squeezed appears to have turned into a legitimate bullish rally that’s erased the bulk of the pair’s August losses.
EUR/USD Four-Hour Price Chart: V-Shaped Reversal into Prior Swing-Highs

Chart prepared by James Stanley
At this stage, RSI on the four-hour chart has moved well into overbought territory, and prices are continuing to test this area of resistance. This was the third and final area of resistance we were looking at in the pair in this week’s FX Setups, and if bears don’t respond here and prices push up to fresh August highs, traders have to open to the possibility of longer-term reversal of the bearish theme that’s been driving price action over the past four months.
EUR/USD Four-Hour Price Chart: RSI Moves From Oversold to Overbought in One Week
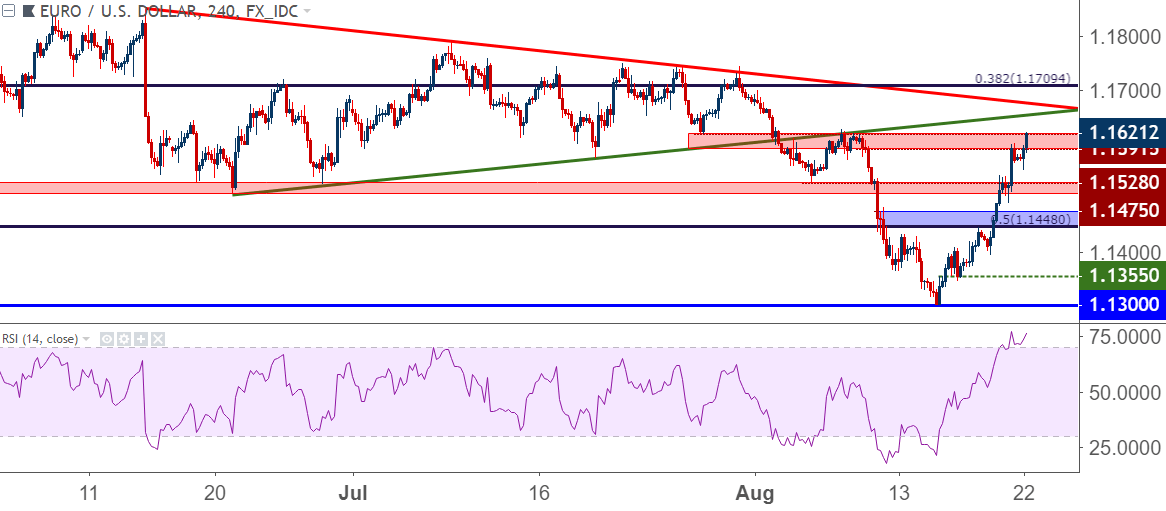
Chart prepared by James Stanley
On a longer-term basis, traders would likely want to let the pair trade above the bearish trend-line taken from the June and July swing highs, or perhaps even the Fibonacci level at 1.1709 before looking to work the move up to fresh August highs.
EUR/USD Daily Price Chart: Approaching Batch of July Swing Highs
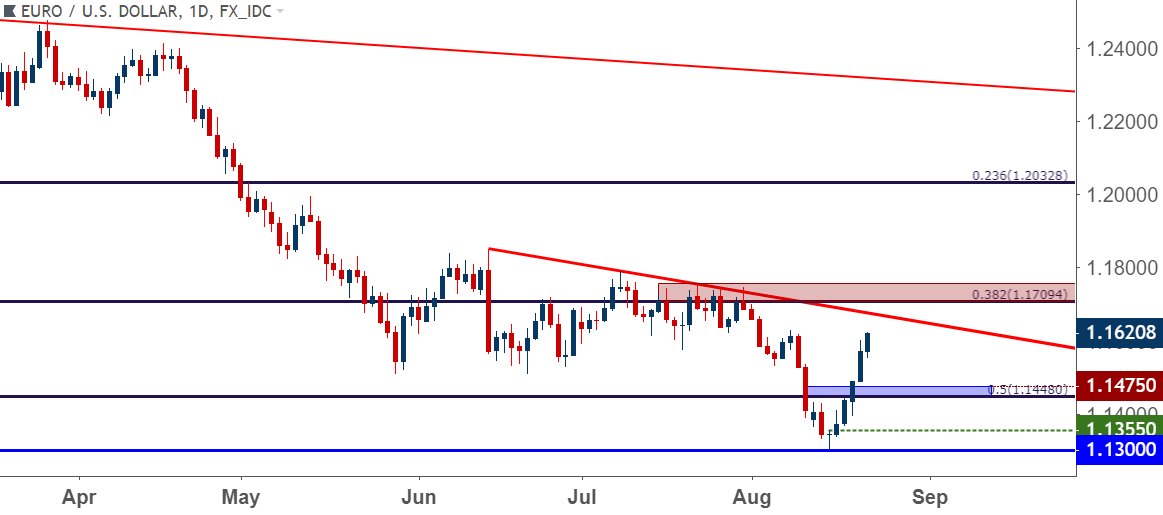
Chart prepared by James Stanley
GBP/USD: Cable Stalls at ‘R2’ Resistance, More Gains in Store
Coming into this week we looked at recovery potential in GBP/USD, largely because of just how oversold and bearish the pair had become in the wake of the BoE rate hike that took place earlier in the month. Last week saw RSI on both Daily and Weekly charts in GBP/USD move to oversold levels. And this happened as a big long-term Fibonacci level came into play around 1.2671. We were looking for a corrective move to bring prices a bit closer to the bearish trend-line taken from the July swing-highs.
That has taken place so far throughout this week, and prices are now buckling up against the underside of the second zone of resistance that we were looking for. This runs from 1.2918 up to 1.2956, and after coming into play yesterday afternoon, bulls have yet to show an ability to punch prices through this zone.
GBP/USD Four-Hour Price Chart: Bullish Advance Slows Upon Test of ‘R2’ Zone
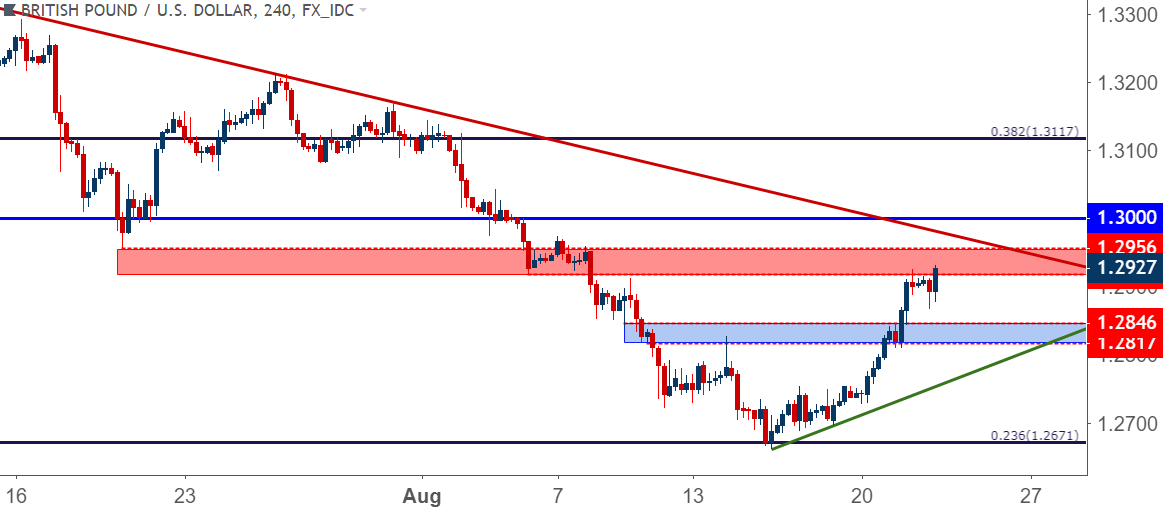
Chart prepared by James Stanley
The big question at this point is whether bears return to re-grab control of price action in the pair. While Cable has been in an aggressive sell-mode since mid-April, US Dollar strength has most definitely been a factor. If we do see the US Dollar continuing to pullback, or perhaps even reversing the prior bullish theme, it does keep the prospect of a longer-term bullish move in GBP/USD as a possibility. However – the recovery move that we’ve seen thus far in Cable has been a bit more subdued than what was seen above in EUR/USD. As such, traders would likely want a higher-bar set for bullish themes in the pair, with the 1.3000 level continuing to hold interest. If prices break above the bearish trend-line taken from the July highs along with the psychological level of 1.3000, longer-term topside themes could begin to become attractive again after a four-month and 1700 pip hiatus.
GBP/USD Weekly Price Chart: Non-Completed Morning Star From Fibonacci Support
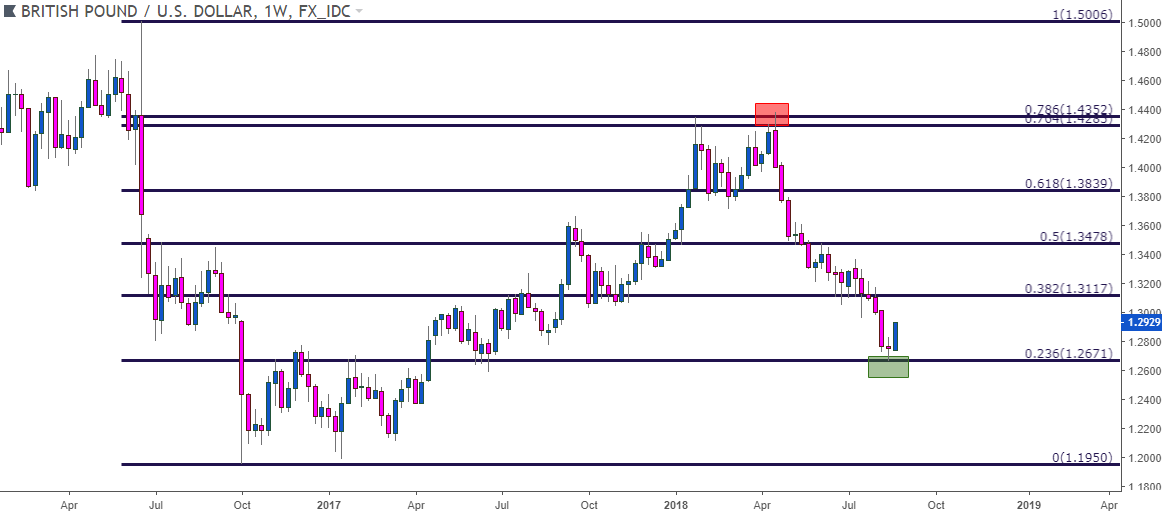
Chart prepared by James Stanley
AUD/USD Recovery Finds Resistance Shy of .7400
Also on the side of US Dollar weakness for this week, we were looking for a larger recovery in AUD/USD after a big long-term support zone came into play last week. This is the confluent zone of Fibonacci support that runs around the .7200 level, and this area had turned around two aggressive bearish advances in 2016 and hasn’t come back into play since. Until last Wednesday, at least.
Prices have since broken higher, but that enthusiasm appears to have started to wane as prices have pulled back to a greater degree than what was seen in both of the above setups of EUR/USD and GBP/USD.
This alludes to the fact that those looking to play a return of USD-strength may be better served in AUD/USD, where a bit of short-term weakness has already started to show; whereas EUR/USD is surging up to fresh short-term highs while GBP/USD holds the line of resistance.
AUD/USD Four-Hour Price Chart: Waning Enthusiasm Past 24 Hours

Chart prepared by James Stanley
To read more:
Are you looking for longer-term analysis on the U.S. Dollar? Our DailyFX Forecasts for Q3 have a section for each major currency, and we also offer a plethora of resources on USD-pairs such as EUR/USD, GBP/USD, USD/JPY, AUD/USD. Traders can also stay up with near-term positioning via our IG Client Sentiment Indicator.
Forex Trading Resources
DailyFX offers a plethora of tools, indicators and resources to help traders. For those looking for trading ideas, our IG Client Sentiment shows the positioning of retail traders with actual live trades and positions. Our trading guides bring our DailyFX Quarterly Forecasts and our Top Trading Opportunities; and our real-time news feed has intra-day interactions from the DailyFX team. And if you’re looking for real-time analysis, our DailyFX Webinars offer numerous sessions each week in which you can see how and why we’re looking at what we’re looking at.
If you’re looking for educational information, our New to FX guide is there to help new(er) traders while our Traits of Successful Traders research is built to help sharpen the skill set by focusing on risk and trade management.
--- Written by James Stanley, Strategist for DailyFX.com
Contact and follow James on Twitter: @JStanleyFX


