


Talking Points:
- The US Dollar has fallen-back to find short-term support at a key area on the chart. This is the potential support zone that we had looked at yesterday taken from the resistance area that held the highs in DXY for a month-and-a-half. The zone runs from 95.00 up to 95.53, but it appears that bulls are already responding to the topside of the zone around 95.53, which was the double top produced by June price action in the US Dollar.
- The economic calendar remains rather light over the next day-and-a-half, up to the release of FOMC meeting minutes from the earlier-August rate decision. Very little happened at that meeting, so the minutes are likely devoid of any game-changing items. More pressing to markets will probably be the minutes release from the most recent ECB rate decision, set for release on Thursday morning, followed by July inflation numbers out of Japan a little later in the day. Friday marks the start of the Jackson Hole Economic Symposium.
- DailyFX Forecasts on a variety of currencies such as the US Dollar or the Euro are available from the DailyFX Trading Guides page. If you’re looking to improve your trading approach, check out Traits of Successful Traders. And if you’re looking for an introductory primer to the Forex market, check out our New to FX Guide.
Do you want to see how retail traders are currently trading the US Dollar? Check out our IG Client Sentiment Indicator.
US Dollar Drops into Support Zone – Will Bulls Respond?
The US Dollar pullback is extending into a fourth day as prices continue to drop after topping out last Wednesday. That prior topside surge lasted for the first half of August, and price action jumped from a support trend-line in late-July and continued to gain all the way up to around the 97.00 level on DXY. Considering the fact that we were sitting below 90.00 just four months ago, and we’ve seen quite the move in USD in a rather short period of time. It was just a few months ago that the US Dollar was still mired in the prior down-trend that saw as much as 15% erased from its value. But in February, prices found support at the 50% retracement of the 2011-2017 major move. In April, we saw bearish themes develop in EUR/USD and GBP/USD, helping to lift the Greenback; and four months later we’re now seeing resistance at the 23.6% retracement of that same major move.
US Dollar Weekly Price Chart: February Support at the 50, Current Resistance at the 23.6% Retracement
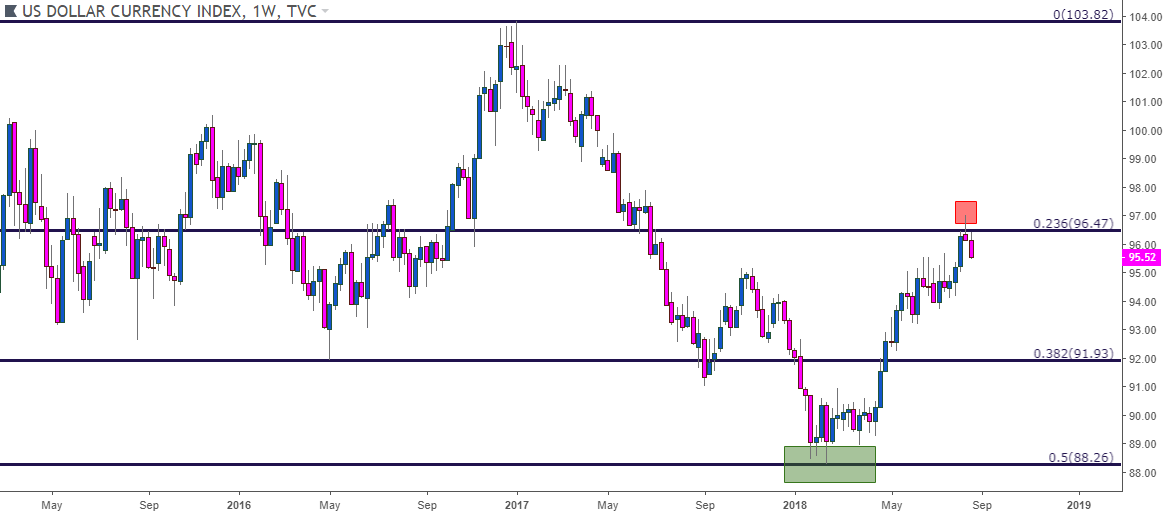
Chart prepared by James Stanley
Nonetheless, buyers have remained active and the structure here remains bullish. We’ve had a few periods of stall or digestion in this move, most recently running from late-May into early-August after prices built into an ascending triangle formation that we looked at a couple of weeks ago. While that formation was building, a zone of resistance had shown that runs from the psychological 95.00 level up to the June swing-high of 95.53.
Prices staged a vigorous topside breakout two weeks ago, and that bullish theme ran all the way into last Wednesday, at which point a retracement or pullback began that hasn’t yet ended. Prices are now testing that prior area of resistance as fresh support.
US Dollar Daily Price Chart: Testing Support (Prior Resistance)

Chart prepared by James Stanley
Looking inside of this resistance zone, there are three areas of note. The first is the level that’s helping to set support right now at 95.53. This was a prices that had produced a short-term double-top in June. Just below that we have the psychological level of 95.00, and this level had helped to set the May swing-high in the pair. And just below that, currently projecting around 94.70 we have the bullish trend-line that helped to set the swing-low in late-July, just before bulls came back in to produce that topside breakout.
US Dollar Four-Hour Price Chart: Support Structure
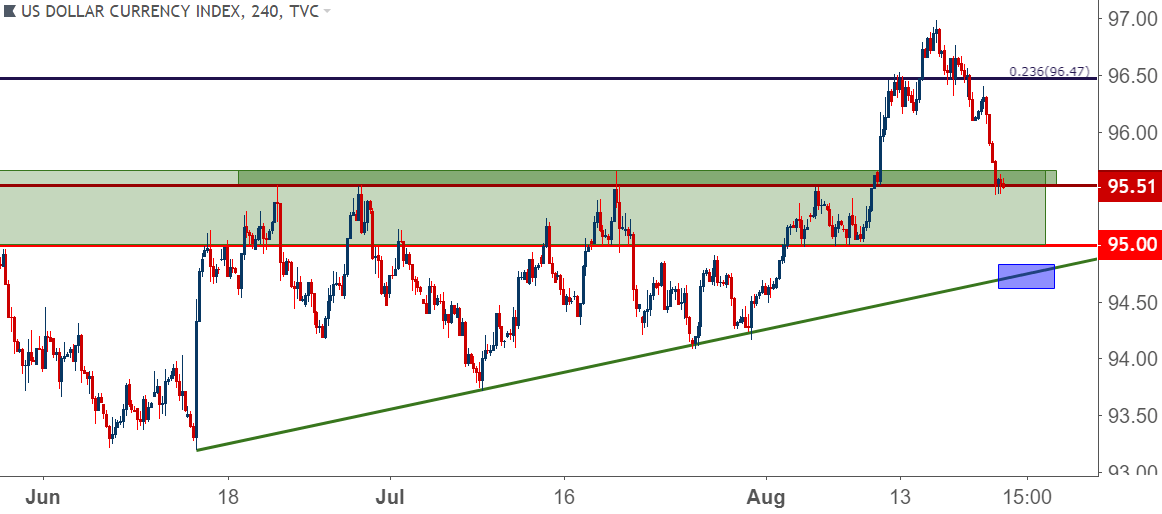
Chart prepared by James Stanley
EUR/USD Testing Resistance Above 1.1500 – Will Bears Respond?
For the past two weeks, we looked at selling strategies around EUR/USD. While the move was rather clean, there was little by way of pullback while bears were pushing-lower. We had an entry that didn’t fill last week, and in our FX Setups for the Week of August 20, 2018, we looked at the same three zones of potential resistance to seek out short-side continuation.
Prices have jumped into the second of those zones, and over the past few hours resistance has started to show. This zone runs from 1.1509 up to 1.1524, taken from June and early-August swing lows, respectively. There’s one more area of resistance that remains attractive for bearish continuation, and if we see a deeper support test in the US Dollar, this will likely come into play. This runs from 1.1592 up to 1.1620.
EUR/USD Four-Hour Price Chart: Testing ‘R2’ Zone of Resistance

Chart prepared by James Stanley
EUR/JPY as a EUR/USD Alternative
Also in this week’s FX Setups, we looked at a short-side play in EUR/JPY in the effort of trading the Euro move without the US Dollar. This may be a more attractive theme for those looking to isolate Euro weakness as the US Dollar appears to be going through its own support issues at the moment.
Last week saw EUR/JPY bounce from the same 125.00 area of support that had provided a reversal in late-May. This happened after a rather brutal down-side breakout took place earlier in the month when prices slid below the key Fibonacci level at 128.52. That led into a 400+ pip run until support came in off of that 125.00 area, and since then we’ve been plotting for lower-high resistance. There are two zones of relevance here, the first of which is drawn from a group of prior swing-lows from 127.23 up to 127.50. The next is that prior support level that led to the outsized bearish breakout around 128.52.
EUR/JPY Four-Hour Price Chart
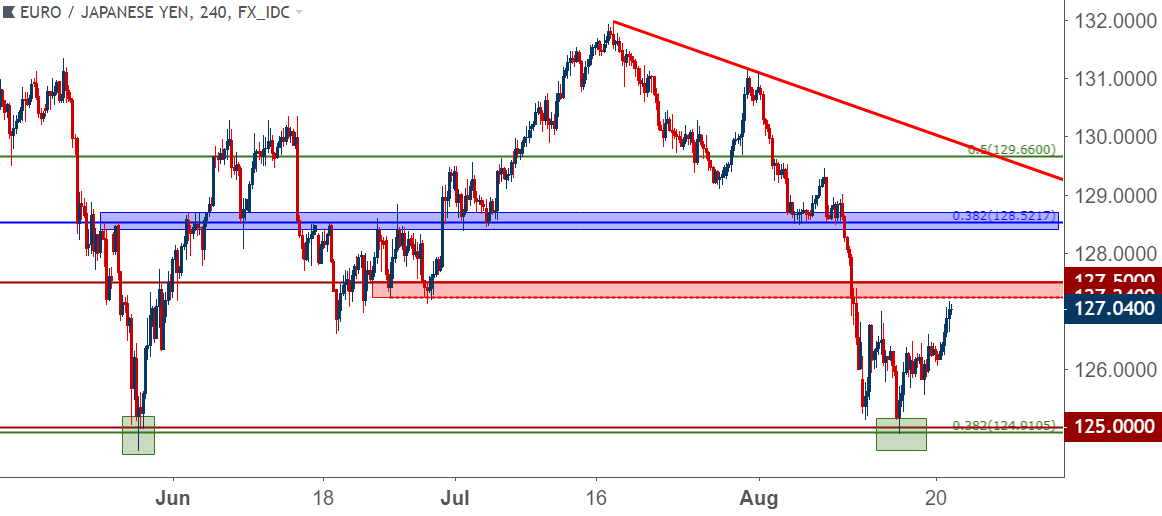
Chart prepared by James Stanley
GBP/USD Rises into First Resistance Zone: Can Bulls Continue to Push
Coming into this week we looked at counter-trend setups in the British Pound, largely on the basis of just how oversold the pair had become as a long-term Fibonacci level was coming into play as support. That theme has played out thus far and prices are now working within the first zone of resistance we had looked at, and this is the same price that helped to trigger into short-side setups last week. This zone runs from the prior swing-lows of 1.2817 up to 1.2846.
GBP/USD Hourly Price Chart: Cable Rises into Resistance Zone
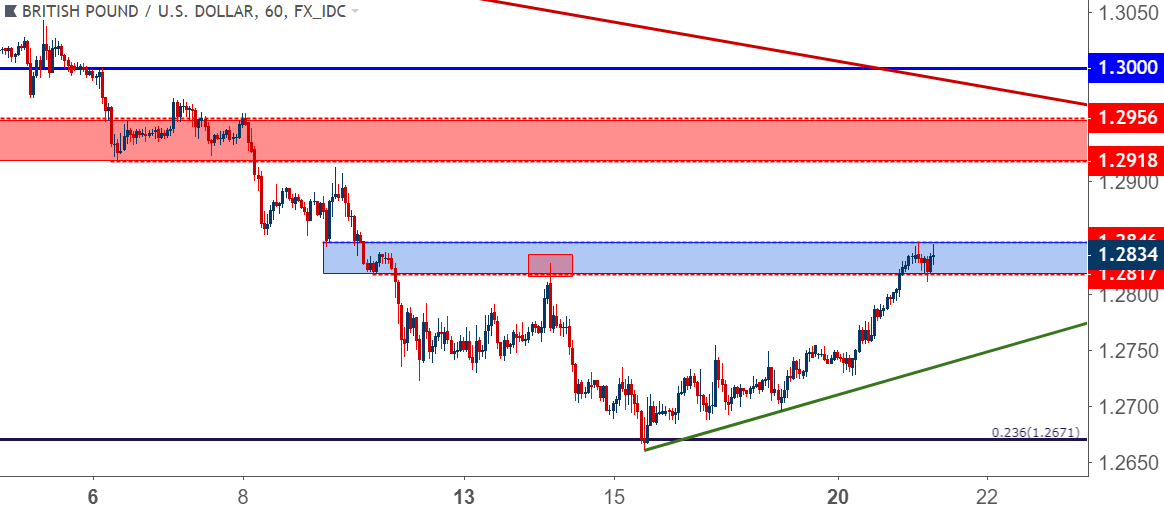
Chart prepared by James Stanley
At this stage, the longer-term bearish trend remains but bears have yet to show any signs of pressure at this area on the chart. So it appears as though this short-term theme of strength may be able to run for longer until a deeper area of potential resistance might come into play. The next area that we’re looking for runs from 1.2918 up to 1.2956, again taken from a group of prior swing-lows.
GBP/USD Four-Hour Price Chart
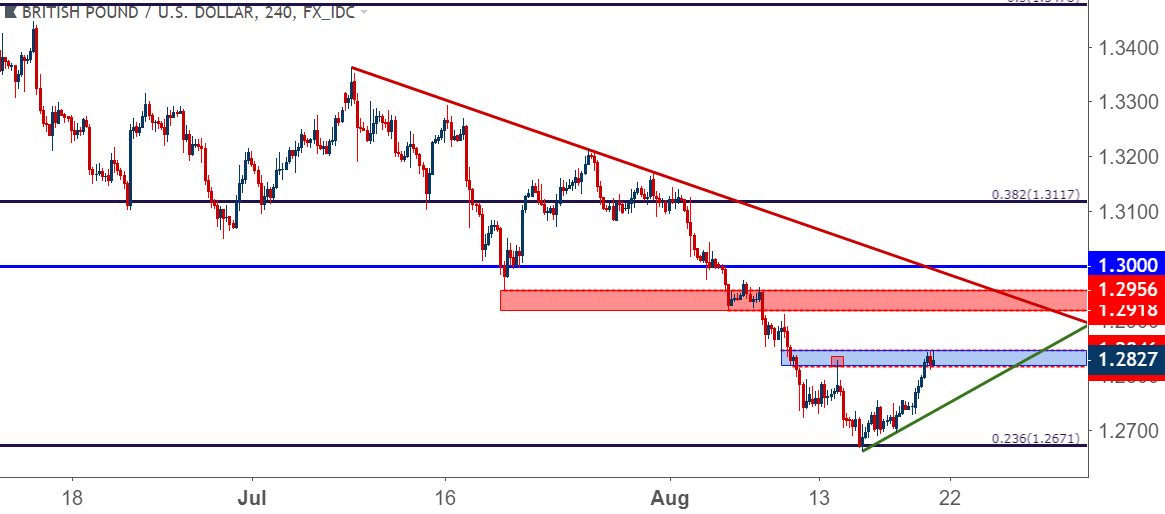
Chart prepared by James Stanley
AUD/USD Bounces From Confluent Support
On that topic of long-term support levels, AUD/USD started a test of a big zone last week that we looked at in our Thursday webinar. This area around .7200 has two different long-term Fibonacci retracements within 20 pips of each other. The 61.8% retracement of the 2001-2011 major move rests at .7185, and 20 pips higher we have the 76.4% retracement of the 2008-2011 move. Perhaps more importantly, this zone has historical relevance as this area turned around two aggressively-bearish moves in 2016.
AUD/USD Weekly Price Chart: Bounce From Key Support Zone

Chart prepared by James Stanley
We looked at topside setups in the pair as one of our FX Setups for the Week of August 20, 2018, largely on the basis of that support zone coming back into play on Wednesday of last week. Expectations for the bullish move were tempered, however, given the fact that we remain in a longer-term bearish trend, as defined by the bearish trend-line that’s held the highs in the pair so far in 2018.
AUD/USD Daily Price Chart: Bounce from Confluent Support
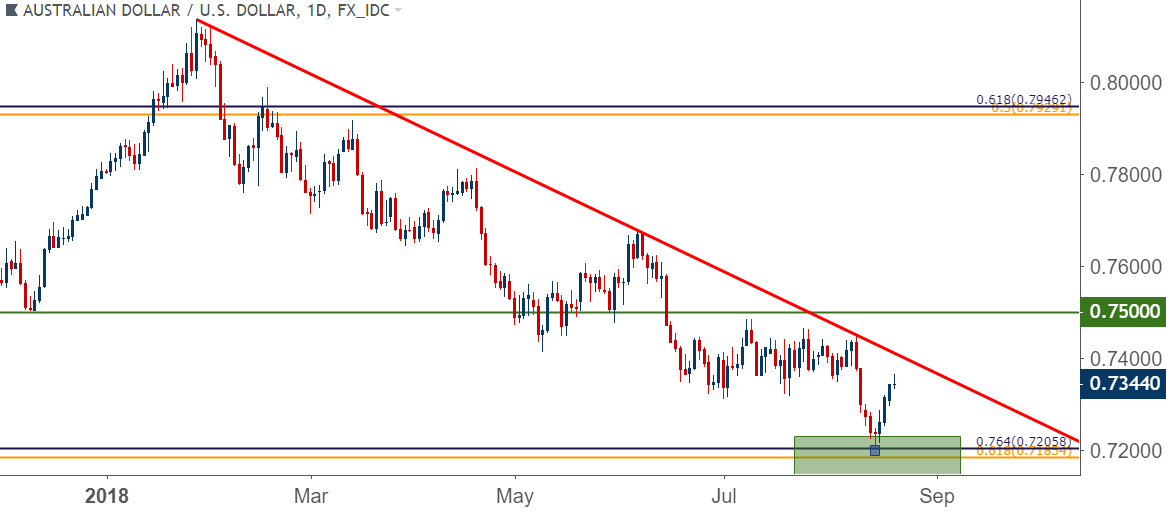
Chart prepared by James Stanley
To read more:
Are you looking for longer-term analysis on the U.S. Dollar? Our DailyFX Forecasts for Q3 have a section for each major currency, and we also offer a plethora of resources on USD-pairs such as EUR/USD, GBP/USD, USD/JPY, AUD/USD. Traders can also stay up with near-term positioning via our IG Client Sentiment Indicator.
Forex Trading Resources
DailyFX offers a plethora of tools, indicators and resources to help traders. For those looking for trading ideas, our IG Client Sentiment shows the positioning of retail traders with actual live trades and positions. Our trading guides bring our DailyFX Quarterly Forecasts and our Top Trading Opportunities; and our real-time news feed has intra-day interactions from the DailyFX team. And if you’re looking for real-time analysis, our DailyFX Webinars offer numerous sessions each week in which you can see how and why we’re looking at what we’re looking at.
If you’re looking for educational information, our New to FX guide is there to help new(er) traders while our Traits of Successful Traders research is built to help sharpen the skill set by focusing on risk and trade management.
--- Written by James Stanley, Strategist for DailyFX.com
Contact and follow James on Twitter: @JStanleyFX


