


Talking Points:
- The US Dollar is pulling back after setting another fresh yearly high yesterday morning. Prices have moved back to the Fibonacci level at 96.47, and we’ve seen a bit of short-term support build at prior resistance. The prior swing-low was set earlier this week at 96.17, and as long as price action remains above this level, bullish strategies can remain attractive around the US Dollar.
- Pullbacks are showing across major currency pairs, with EUR/USD showing the potential for short-term strength while GBP/USD is catching a bounce on a Fibonacci retracement taken from the ‘Brexit move’ in the pair. AUD/USD has run into a key zone of confluent Fibonacci support around .7200. This is the same area that turned around bearish advances twice in 2016, and we’re seeing support set in over the past 24 hours after this level came into play again.
- DailyFX Forecasts on a variety of currencies such as the US Dollar or the Euro are available from the DailyFX Trading Guides page. If you’re looking to improve your trading approach, check out Traits of Successful Traders. And if you’re looking for an introductory primer to the Forex market, check out our New to FX Guide.
Do you want to see how retail traders are currently trading the US Dollar? Check out our IG Client Sentiment Indicator.
US Dollar Strength Begins to Pullback
The bullish theme in the US Dollar perched up to new highs yesterday morning around the open of the US session. But prices soon started to pullback and that theme has lasted into this morning, so not quite 24 hours yet. But – prices in DXY are testing an area of potential support taken from prior resistance, which came-in at the 23.6% Fibonacci retracement of the 2011-2017 major move.
US Dollar Four-Hour Price Chart: Attempting to Hold Higher-Low Support at Prior Fibonacci Resistance

Chart prepared by James Stanley
This level of 96.47 is a key one, as this is the 23.6% level of the same study that helped the US Dollar to find its low in February of this year. The price of 88.26 is the 50% retracement of the 2011-2017 major move, and this level helped the Dollar to turn-around in the middle of Q1
US Dollar Weekly Price Chart
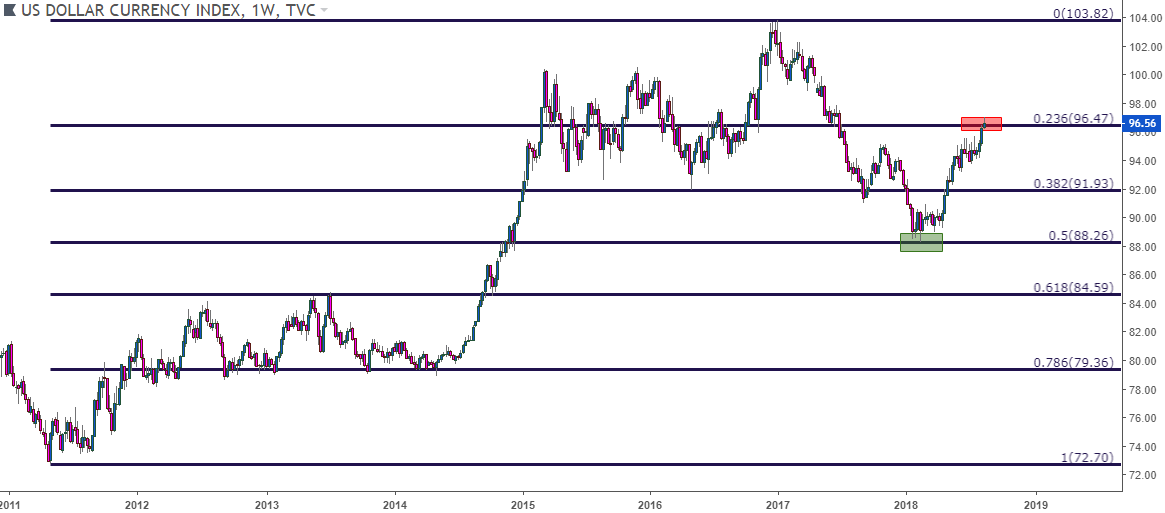
Chart prepared by James Stanley
EUR/USD Bounces From Fresh Yearly Lows
A key driver to that topside move in the Greenback has been a deeper breakdown in EUR/USD. The pair plunged through the 1.1500 level last week as worries were heating up around contagion in European banks from the situation that’s still developing in Turkey. This has pushed EUR/USD down below 1.1300, albeit temporarily, before a bit of buyer support came-in to perch prices higher.
Yesterday produced a Doji as sellers were outnumbered after testing below 1.1300, and this opens the possibility of a deeper retracement after the bearish extension that showed-up to start this week. The resistance levels that we looked at in our FX Setups for this Week could remain of interest for those looking at bearish continuation in the pair.
EUR/USD Daily Price Chart: Yesterday’s Doji Leads to Today’s Extension in Bounce

Chart prepared by James Stanley
On the hourly chart, we can see where buyers have come in to offer a bit of short-term support around prior resistance, and this helps to keep the door open for deeper retracement potential.
EUR/USD Hourly Price Chart

Chart prepared by James Stanley
Cable Runs into 23.6% Support After April’s 78.6% Resistance
Another longer-term Fibonacci level has come into play in GBP/USD, and this is the 23.6% marker from the ‘Brexit move’ that took place in the pair in 2016.
GBP/USD Weekly Price Chart: Fibonacci Support at 23.6% Retracement of the ‘Brexit Move’

Chart prepared by James Stanley
On a shorter-term basis, the bounce that we’ve seen over the past 24 hours hasn’t been as convincing as what was seen above in EUR/USD. Prices have not been able to perch up to a short-term higher-high here and thus, we don’t really have a higher-low to work with after prices dug into that Fibonacci support early yesterday morning.
GBP/USD Hourly Price Chart: Sellers Remain Active After Fibonacci Support Bounce

Chart prepared by James Stanley
AUD/USD Bounces From Confluent Fibonacci Support
The area around the price of .7200 has a couple of key areas of support, as the 76.4% retracement of the 2008-2011 major move resides at .7205 while the 61.8% retracement of the 2001-2011 major move is at .7185. Perhaps more importantly, this zone helped to provide reversal bounces on two separate occasions in 2016, first in May and then again in December. That second test seemed to really bring out the bulls as prices continued higher for the next year and two months before topping out at 81.25.
Price action in 2018 has brought a far different tone, however, and prices have been on a bee-line lower for much of the period. Yesterday saw prices dig-in a bit of support at this same level, and prices have been bouncing ever since.

Chart prepared by James Stanley
On a shorter-term basis, there are two potential areas of resistance that can be worked with in the pair. We had a prior swing of support around .7325, and that had held from late-July up until Friday’s down-side break; and if that doesn’t come into play, there’s a bearish trend-line that current projects around the .7400 handle. Each of these areas keeps the door open for bearish continuation in the pair, and stops can be investigated above the psychological level of .7500.
AUD/USD Daily Price Chart: Potential Resistance for Bearish Continuation

Chart prepared by James Stanley
To read more:
Are you looking for longer-term analysis on the U.S. Dollar? Our DailyFX Forecasts for Q1 have a section for each major currency, and we also offer a plethora of resources on USD-pairs such as EUR/USD, GBP/USD, USD/JPY, AUD/USD. Traders can also stay up with near-term positioning via our IG Client Sentiment Indicator.
Forex Trading Resources
DailyFX offers a plethora of tools, indicators and resources to help traders. For those looking for trading ideas, our IG Client Sentiment shows the positioning of retail traders with actual live trades and positions. Our trading guides bring our DailyFX Quarterly Forecasts and our Top Trading Opportunities; and our real-time news feed has intra-day interactions from the DailyFX team. And if you’re looking for real-time analysis, our DailyFX Webinars offer numerous sessions each week in which you can see how and why we’re looking at what we’re looking at.
If you’re looking for educational information, our New to FX guide is there to help new(er) traders while our Traits of Successful Traders research is built to help sharpen the skill set by focusing on risk and trade management.
--- Written by James Stanley, Strategist for DailyFX.com
Contact and follow James on Twitter: @JStanleyFX


