


Talking Points:
- The US Dollar continued its bullish run upon this week’s open, quickly pushing up to the same 95.50 level that’s turned around topside advances twice in June and then again in July. Prices have quickly reversed after yesterday’s US open, and the 95.00 level has come into play as potential short-term support in DXY.
- This week’s economic calendar is quite a bit more calm than the prior couple of weeks, but Friday brings a key piece of inflation data out of the United States that could give additional motivation to US Dollar bulls. The short-side of EUR/USD could remain attractive for such a theme, as could the topside of USD/JPY should a key area of support hold on that chart.
- DailyFX Forecasts on a variety of currencies such as the US Dollar or the Euro are available from the DailyFX Trading Guides page. If you’re looking to improve your trading approach, check out Traits of Successful Traders. And if you’re looking for an introductory primer to the Forex market, check out our New to FX Guide.
Do you want to see how retail traders are currently trading the US Dollar? Check out our IG Client Sentiment Indicator.
US Dollar Pulls Back Shy of 95.53 June Resistance
The week opened with strength in the US Dollar, but that quickly came into question upon a re-test of the 95.53 highs that have been showing as resistance in DXY since late June. As we looked at last week, the Dollar jumped into an area on the chart in which bulls have had a difficult time holding on to strength. This area above 95.00 on DXY has been tested on five separate occasions leading into our most recent test, each of which has faltered thus far.
US Dollar Daily Price Chart
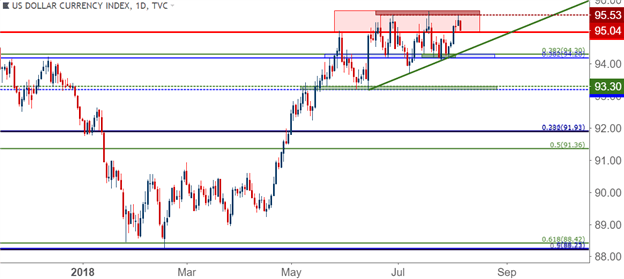
Chart prepared by James Stanley
Last week saw the Dollar start off with a support test, but soon we saw surge into this resistance zone after the one-two combo of Wednesday’s FOMC and Thursday’s BoE. It became rather clear around those rate decisions that the Federal Reserve is the outlier as the one major Central Bank actively looking to drive rates higher, and the bullish response that we’ve seen in the USD mirrors that.
DXY has moved all the way up to 95.50, at which point a pullback began to show. This would be just shy of the high watermark set in late-June. Price action is making a fast move back-towards the 95.00 level, and this sets the stage for US inflation numbers set to be released later this week.
US Dollar via ‘DXY’ Four-Hour Price Chart: Pulls Back Shy of 95.53

Chart prepared by James Stanley
Bullish continuation can remain a workable theme given current structure, particularly if we see support show around the 95.00 level. This can be linked with the swing-highs from the final week of July to produce a potential support zone around the psychological level.
US Dollar Four-Hour Price Chart

Chart prepared by James Stanley
EUR/USD Bounce After Failed Attempt to Test 1.1500
EUR/USD put in a couple of rather rigid bounces in May and then again in June. Each time, bears remained in-control until the 1.1500 psychological level came into view. As we walked into June, hope for a hawkish twist at the ECB pushed the pair-higher; and when that didn’t come to fruition in June, prices posed another bearish drop with sellers drying up just shy of 1.1500. This has produced a double bottom formation at 1.1509, and prices made a third approach at this level shortly after the open of this week.
But, once again, bears dried up before we saw a test of support, and prices have started to bounce-higher.
EUR/USD Four-Hour Price Chart
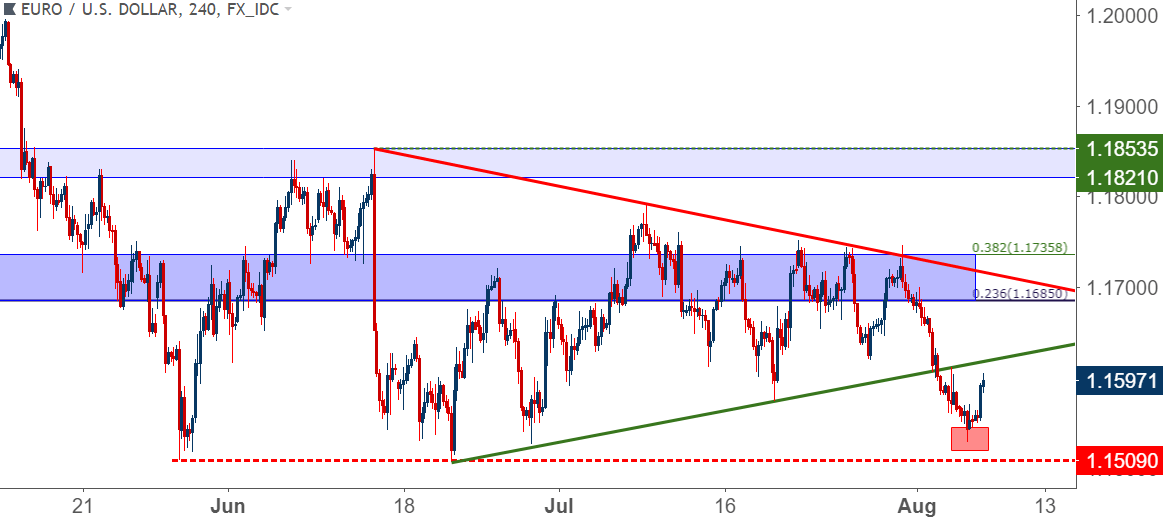
Chart prepared by James Stanley
On a shorter-term basis, the structure for bearish strategies remains. Prices are nearing a test of the prior swing-high around 1.1611, and that can be synced with the prior swing-low around 1.1623 to produce a potential short-term resistance zone in the pair. If sellers show-up here, the door remains open for bearish continuation down to the 1.1509 prior low.
EUR/USD Hourly Price Chart
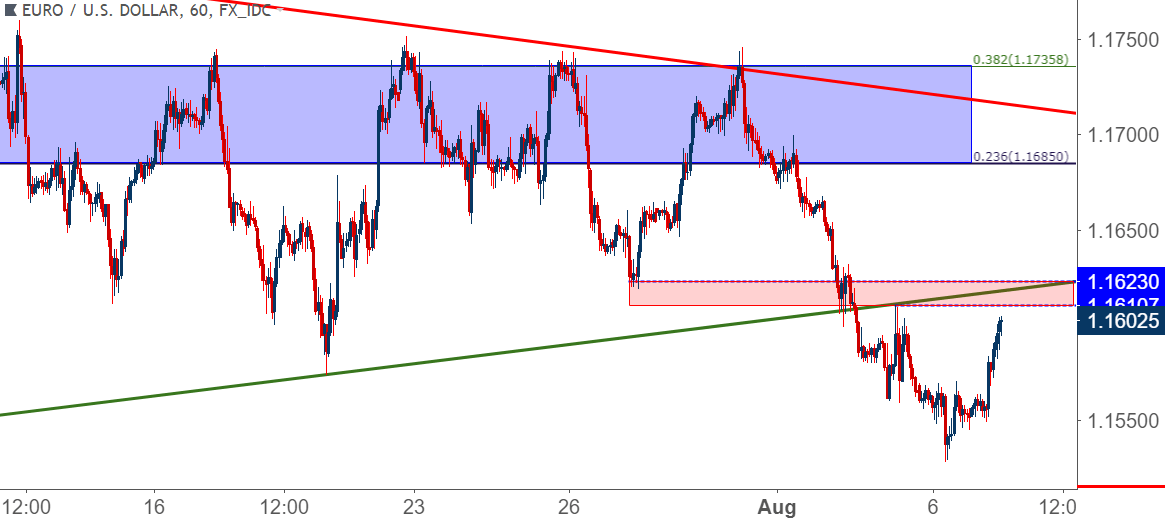
Chart prepared by James Stanley
GBP/USD Falls Below 1.3000 After BoE Rate Hike
Sellers remain in control in GBP/USD after last week’s rate hike out of the Bank of England. The response after that dovish rate hike has continued to push the pair lower, with sellers remaining active below the vaulted psychological level of 1.3000. At this point, it could be difficult to justify bearish continuation given the stretched nature of the move combined with the fact that the pair continues to sit near fresh 11-month lows.
GBP/USD Daily Price Chart: Sitting at 11-Month Lows After Burst Below 1.3000
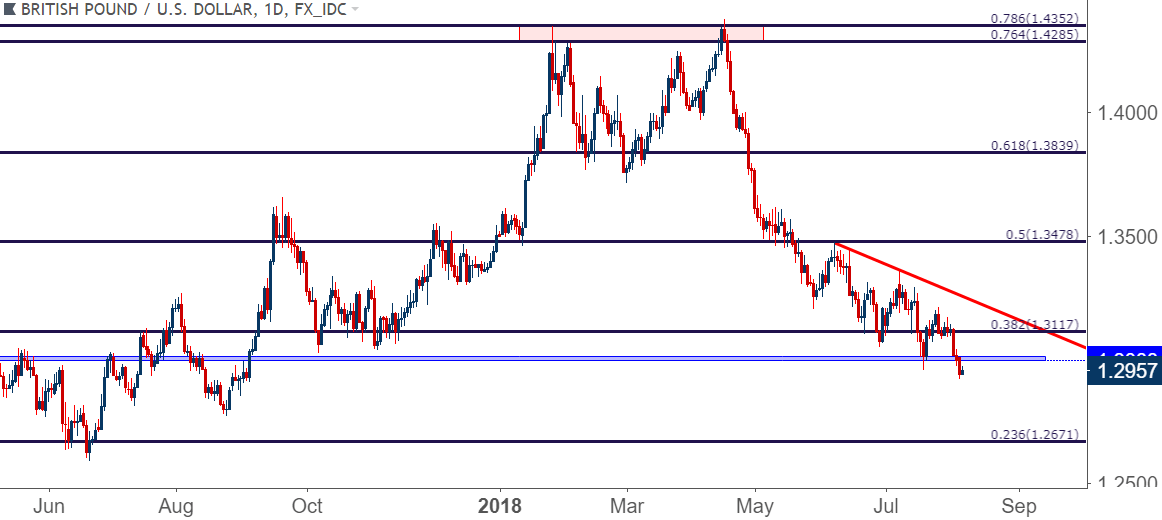
Chart prepared by James Stanley
For resistance levels – the 1.3000 is obvious, although any tests of resistance there are likely to be messy given how much gyration showed when prices were breaking-lower. We’ve also picked out two additional areas of resistance above 1.3000 but still below the Fibonacci level at 1.3117; the last of which begins to align later this week with the bearish trend-line taken from the July and August swing-highs.
GBP/USD Four-Hour Price Chart
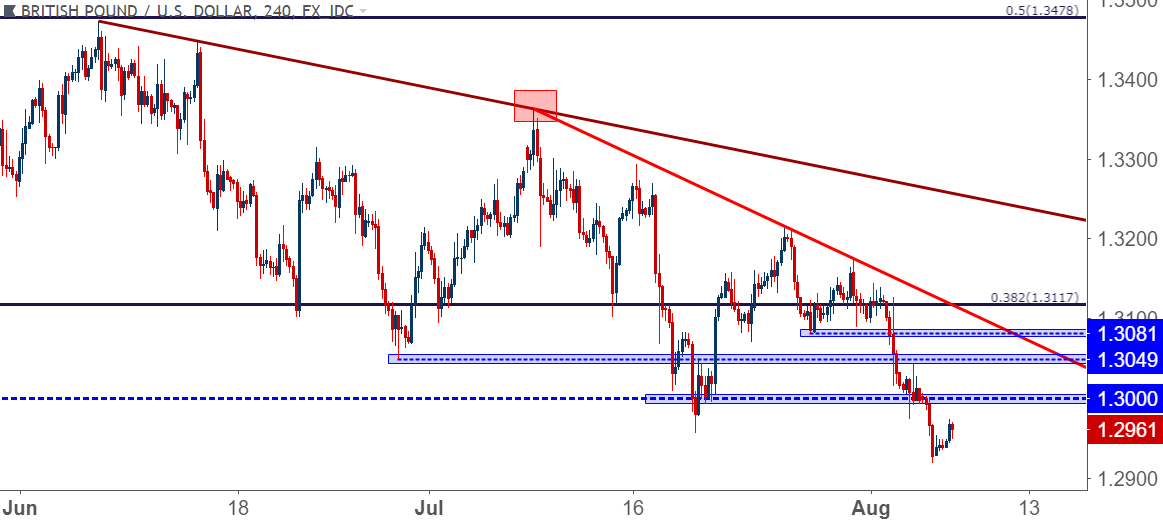
Chart prepared by James Stanley
USD/JPY Continues Pullback
Noticeably missing during this run of USD-strength was continuation in USD/JPY. The pair broke-out early last week after the Bank of Japan rate decision saw the bank make minor tweaks to their QE outlay. This put in a move that caught the first of our targets in a topside setup; but prices promptly began to pullback last Wednesday around FOMC, and that pullback has largely continued ever since.
The big question at this point is whether we see a hold of support above the 110.50 level that we had looked at last week. This comes-in around the projection of a prior resistance trend-line, and the previous couple of weeks have seen bulls dig-out higher-low support around this area.
USD/JPY Daily Price Chart
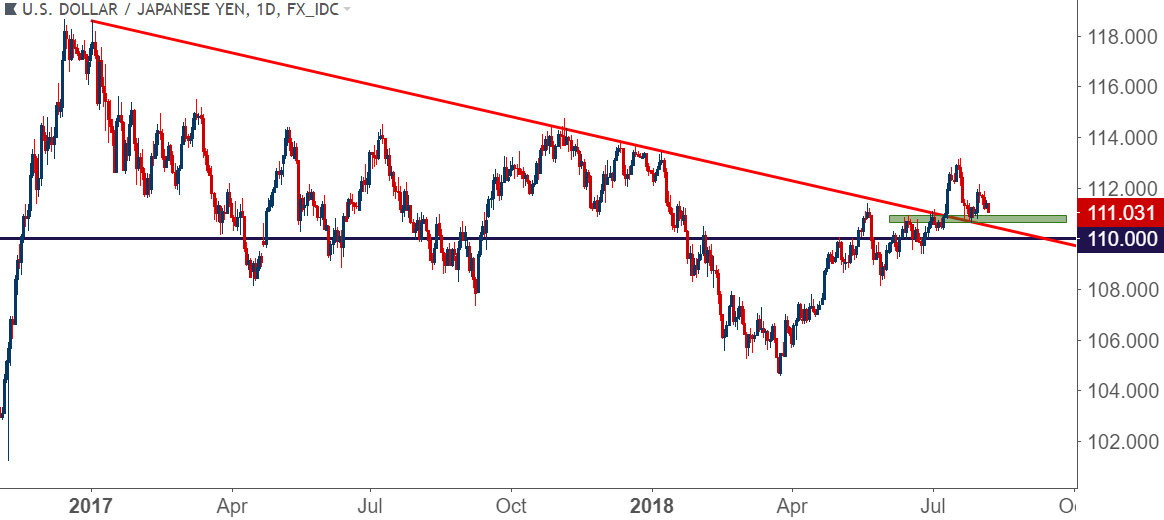
Chart prepared by James Stanley
On a shorter-term basis, we can focus-in on the bullish move that began just ahead of the June open, and applying a Fibonacci retracement shows the 50% marker of that move at 110.64, with the 61.8% retracement showing very closely to the 110.00 psychological level. A hold of support around 110.50 keeps the door open for bullish strategies with stops below the 110.00 level, targeting a return towards prior highs around 112.00 and again around 113.00.
USD/JPY Four-Hour Price Chart

Chart prepared by James Stanley
To read more:
Are you looking for longer-term analysis on the U.S. Dollar? Our DailyFX Forecasts for Q3 have a section for each major currency, and we also offer a plethora of resources on USD-pairs such as EUR/USD, GBP/USD, USD/JPY, AUD/USD. Traders can also stay up with near-term positioning via our IG Client Sentiment Indicator.
Forex Trading Resources
DailyFX offers a plethora of tools, indicators and resources to help traders. For those looking for trading ideas, our IG Client Sentiment shows the positioning of retail traders with actual live trades and positions. Our trading guides bring our DailyFX Quarterly Forecasts and our Top Trading Opportunities; and our real-time news feed has intra-day interactions from the DailyFX team. And if you’re looking for real-time analysis, our DailyFX Webinars offer numerous sessions each week in which you can see how and why we’re looking at what we’re looking at.
If you’re looking for educational information, our New to FX guide is there to help new(er) traders while our Traits of Successful Traders research is built to help sharpen the skill set by focusing on risk and trade management.
--- Written by James Stanley, Strategist for DailyFX.com
Contact and follow James on Twitter: @JStanleyFX


