


Talking Points:
- US Dollar strength has continued and the currency has traded up to fresh one-year highs, testing above the 95.53 resistance swing that had showed up last month. This continues what has become a rather pronounced rally in the Greenback after the earlier-week test of support, and this keeps the door open for bullish continuation as we move deeper into the year.
- This continuation of USD strength has come along with bearish pushes in both GBP/USD and EUR/USD, each of which carries varying degrees of continuation potential. In GBP/USD, traders would likely want to observe oversold conditions as Daily RSI has been showing divergence for some time now, and the pair is testing a key psychological level. Meanwhile in EUR/USD, we have an ECB meeting on the calendar for next week and the pair is approaching a key area of support around the 1.1500 level; of which a break-through can open the door for bearish breakout strategies.
- DailyFX Forecasts on a variety of currencies such as the US Dollar or the Euro are available from the DailyFX Trading Guides page. If you’re looking to improve your trading approach, check out Traits of Successful Traders. And if you’re looking for an introductory primer to the Forex market, check out our New to FX Guide.
Do you want to see how retail traders are currently trading the US Dollar? Check out our IG Client Sentiment Indicator.
US Dollar to Fresh One-Year Highs
The US Dollar’s bullish bounce from support took a short break yesterday around Jerome Powell’s second day of testimony; and after a pull back to the 95.00 level on DXY, prices have re-ascended and are heading directly for the June swing high. That June swing high at 95.53 saw two separate failures at this level, first on June 21st and again a week later. We’re now nearing this level for another test, and the big question is whether bulls will be able to keep pushing; or whether we’ll walk away with a third failed attempt at taking out the 95.53 level.
US Dollar via ‘DXY’ Four-Hour Price Chart: Testing Fresh One-Year Highs

Chart prepared by James Stanley
Taking a step back to look at longer-term charts in order of deriving potential targets, we can see a series of levels just above current resistance that could soon become of interest. The level of 96.04 is the 50% retracement of the 2017-2018 down-trend, and the 38.2% retracement of that level had previously helped to mark support in DXY at 94.20. At 96.45, we have the 23.6% retracement of the 2011-2017 major move, and a bit-higher around the 98.00 level, we have a confluent area of potential resistance, as we have the 23.6% marker of the 2014-2017 major move, along with the 61.8% retracement of the 2017-2018 down-trend.
These are the same levels we shared as targets for the currency in our Q3 technical forecast on the US Dollar, and that full report is available directly from the following link: US Dollar Q3 Forecast, DailyFX Trading Guides.
US Dollar via ‘DXY’ Daily Price Chart

Chart prepared by James Stanley
GBP/USD Breaks 1.3000, More Weakness to Follow?
The sell-off in the British Pound is continuing into this morning, and GBP/USD is now testing below the 1.3000 level for the first time in ten months. This comes after two days of negative data: Yesterday’s disappointing inflation report was followed by this morning’s disappointing retail sales, both of which have helped to give bears a bit more running room. Each of these data points make the prospect of a rate hike from the BoE in a couple of weeks seem less-likely, and if we do see an actual rate rise out of the bank this year, November may be more likely as we should have a greater deal of clarity on the Brexit-front.
At this point the one potentially positive driver behind the currency, the potential for a rate hike out of the BoE, is coming into question and that’s helping bears push prices below support. But – we may be nearing a point where the currency is so oversold that bearish strategies might want to take a step back to wait for a cleaner setup. We’ve seen RSI diverge on the daily chart over the past couple of months and this highlights just how oversold this trend has become. And while oversold doesn’t preclude the possibility of further losses, it does set the bar a bit higher for short-side strategies. Traders looking to work with bearish continuation will likely want to wait for a pullback to potential resistance, and areas such as 1.3050 or even 1.3117 could be usable for such a purpose.
GBP/USD Daily Price Chart: Divergent RSI Highlights Oversold Conditions in the Pair
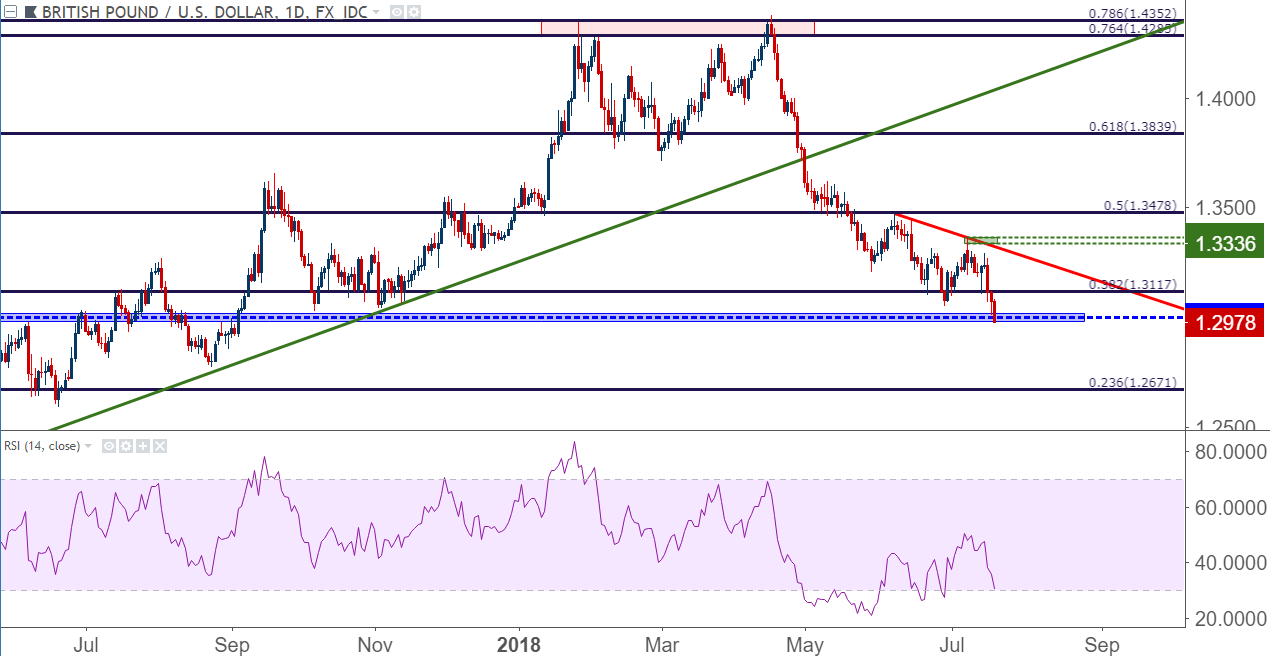
Chart prepared by James Stanley
EUR/USD Sets Fresh July Low, Key 1.1500 Support Nears
EUR/USD bears have re-gained control in the pair after an initial move of strength to open Q3, and prices are now trading at fresh July lows after a continuation of yesterday’s downside run. Price action is making a move towards the support swing that showed in May and June around 1.1509, just a bit above the 1.1500 psychological level.
At the core of the move is the dovish posture around the ECB that caught another gust of motivation around the bank’s June meeting. That will come further into view next week as the European Central Bank hosts their July rate decision, set to be announced next Thursday morning (July 26th, 2018). If the ECB is able to show a continued dovish stance even despite the fact that inflation is running very near the bank’s goal of 2%, the stage could be set for a showdown at this low along with the potential for a deeper bearish breakdown.
EUR/USD Daily Price Chart
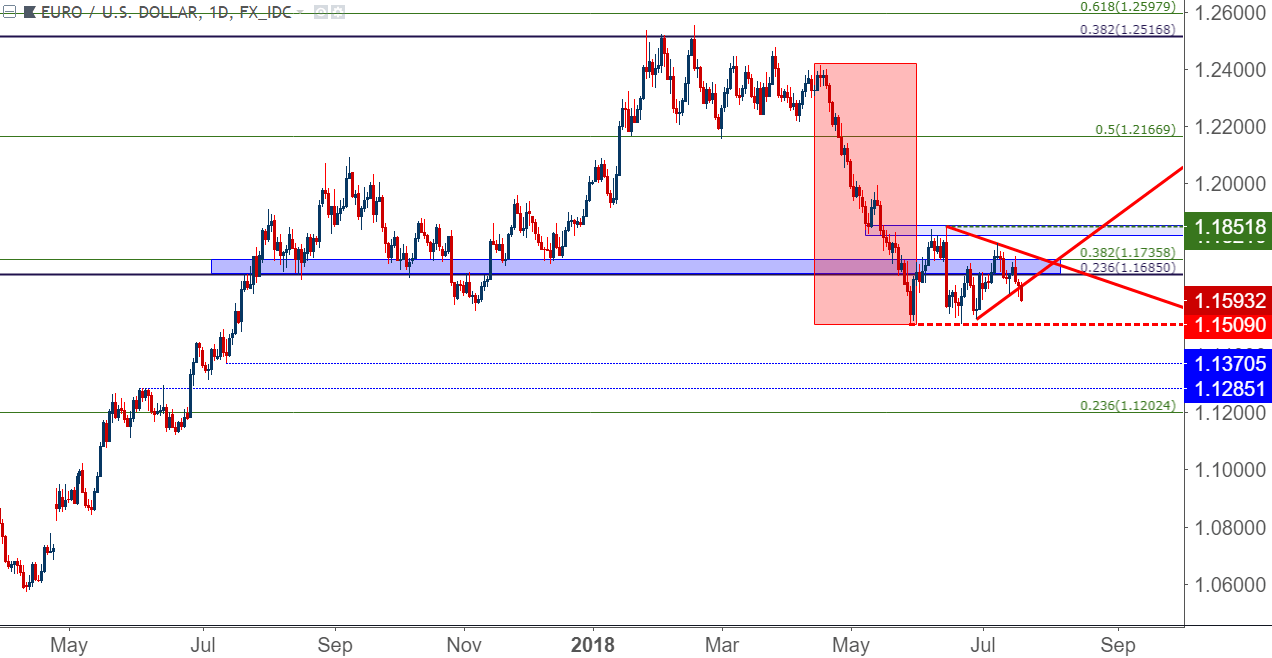
Chart prepared by James Stanley
To read more:
Are you looking for longer-term analysis on the U.S. Dollar? Our DailyFX Forecasts for Q1 have a section for each major currency, and we also offer a plethora of resources on USD-pairs such as EUR/USD, GBP/USD, USD/JPY, AUD/USD. Traders can also stay up with near-term positioning via our IG Client Sentiment Indicator.
Forex Trading Resources
DailyFX offers a plethora of tools, indicators and resources to help traders. For those looking for trading ideas, our IG Client Sentiment shows the positioning of retail traders with actual live trades and positions. Our trading guides bring our DailyFX Quarterly Forecasts and our Top Trading Opportunities; and our real-time news feed has intra-day interactions from the DailyFX team. And if you’re looking for real-time analysis, our DailyFX Webinars offer numerous sessions each week in which you can see how and why we’re looking at what we’re looking at.
If you’re looking for educational information, our New to FX guide is there to help new(er) traders while our Traits of Successful Traders research is built to help sharpen the skill set by focusing on risk and trade management.
--- Written by James Stanley, Strategist for DailyFX.com
Contact and follow James on Twitter: @JStanleyFX
https://www.dailyfx.com/forex/fundamental/daily_briefing/session_briefing/daily_fundamentals/2018/07/18/US-Dollar-jumps-to-july-high-gbpusd-folds-on-inflationd-data-srepstans.html


