


Talking Points:
- The US Dollar has started off Q3 in a rather directionless manner, first rallying and then pulling back, and we’re very near where we started the fresh quarter. The big question around the Greenback as we move deeper into the second-half of the year is whether the strength that showed in Q2 has continuation power, or whether that was but a blip in the radar of the longer-term trend. If you’d like to see the longer-term Quarterly Forecast on the US Dollar, DailyFX has recently released our forecasts as part of our Trading Guides, which are available directly from the following link: DailyFX: US Dollar Q3 Forecast.
- EUR/USD has started off Q3 with a re-test of a key zone of resistance, and short-term dynamics indicate that we may get a deeper retracement before the bearish trend is ready for resumption. USD/JPY, meanwhile, has not been shy about setting fresh highs as the pair has moved to a fresh five-week high as we open Q3. The big question around the Yen is whether another spate of weakness develops, and this is likely tied to the larger themes of global risk aversion. With inflation in Japan remaining tame, and the ECB moving towards stimulus taper, the door can remain open for Yen weakness should ‘flight to quality’ or ‘safe-haven’ themes take a back seat to the ‘risk on’ trade.
- DailyFX Forecasts on a variety of currencies such as the US Dollar or the Euro are available from the DailyFX Trading Guides page. If you’re looking to improve your trading approach, check out Traits of Successful Traders. And if you’re looking for an introductory primer to the Forex market, check out our New to FX Guide.
Do you want to see how retail traders are currently trading the US Dollar? Check out our IG Client Sentiment Indicator.
Directionless Dollar to Kick off Q3
Last quarter ended on a strong note for the US Dollar, and this helped to break the slump that had lasted for much of the prior year. The bid in USD showed in the third week of April, and carried the currency for the duration of the quarter, eventually helping to produce an 11-month high just a couple of days ahead of quarter-end.
With this week being a holiday-week in the United States, as tomorrow is Independence Day and many traders have taken vacation ahead of the holiday, price action has been rather tame thus far with a bit of back-and-forth. The big question is whether we get prices dropping down to re-test the key zone of support that rests from 94.20-94.30.
US Dollar via ‘DXY’ Four-Hour Chart: Dollar Dithers After Bullish Q2

Chart prepared by James Stanley
EUR/USD Testing Resistance to Kick Off Q3
Last quarter saw some rather aggressive selling show up in EUR/USD, and despite three failed attempts to take out the 1.1500 psychological level, the pair very much remained in a bearish state as we closed down the first half of the year. To kick off Q3 the pair is remaining resistant at a key area on the chart, and this is the same zone that had helped to set support in the latter-third of last year, and most recently has started to serve as resistance.
EUR/USD Daily Chart: Continued Resistance at Key Zone 1.1685-1.1736
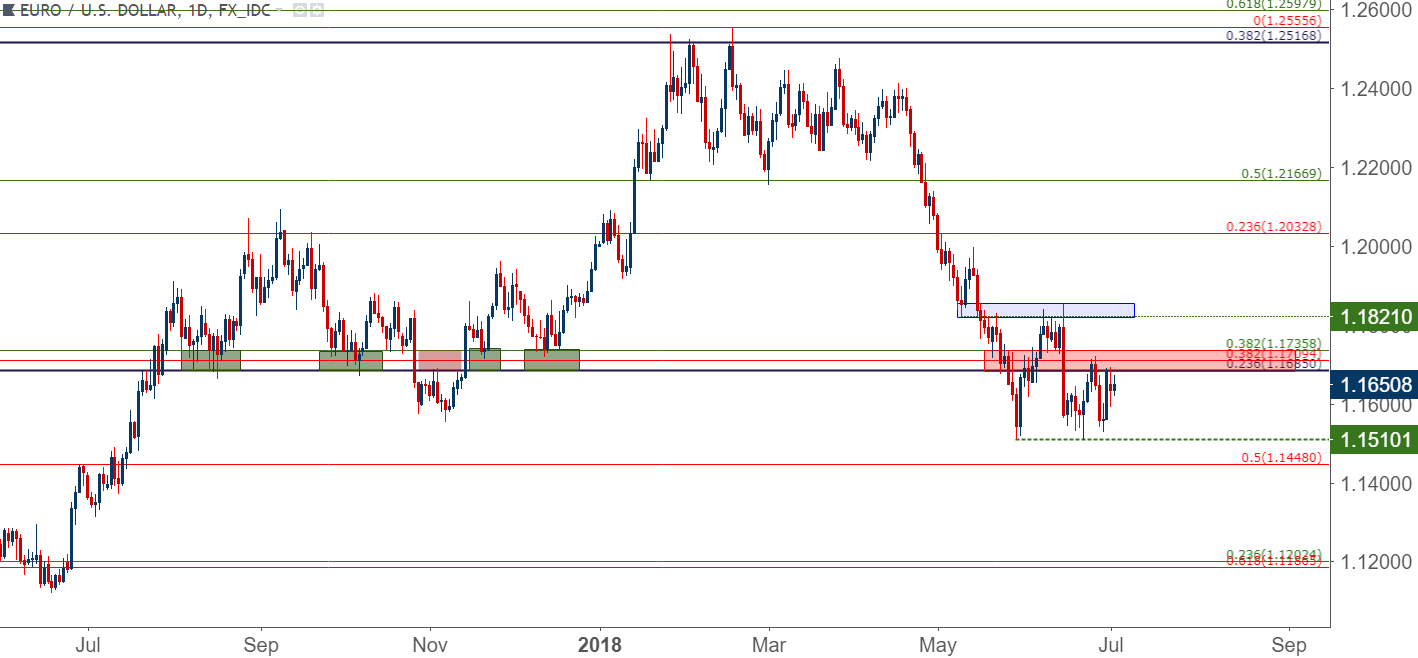
Chart prepared by James Stanley
On a shorter-term basis, we can see where bears have started to get a bit more shy around tests of prior lows. Last Thursday saw a higher-low print about 15 pips above the prior low of 1.1510, and yesterday helped to produce another short-term higher-low, giving the appearance that bears may take a bit of a break, and this can open the door for a deeper retracement in the pair. Above this current resistance zone is another area of resistance, and this is taken from the June swing-high that showed around 1.1855. As long as prices remain below this swing, the door remains open for selling.
EUR/USD Four-Hour Chart: Bearish Trepidation at Prior Lows, Deeper Retracement Potential
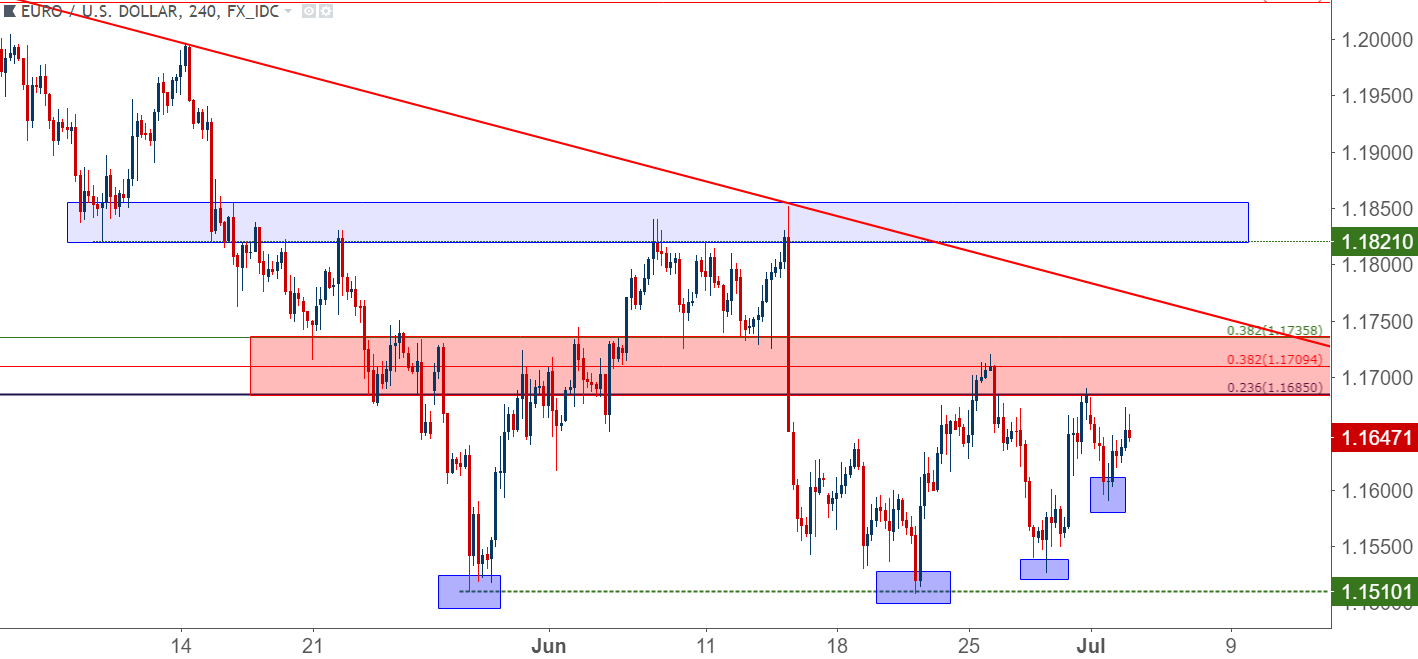
Chart prepared by James Stanley
Yen Weakness Re-Emerges
One notable observation thus far in the new quarter is a return of Yen weakness. USD/JPY moved up to a fresh five-week high to kick off Q3, and the pair is pulling back a bit after finding fresh sellers above 111.00. This comes after a rather concerted run of Yen weakness started to develop as we wound down Q2, and that theme of USD/JPY strength lasted into this morning’s European open, at which point prices started to pull back.
USD/JPY Four-Hour Chart: Return of Yen Weakness Brings Fresh Five-Week Highs to Start Q3
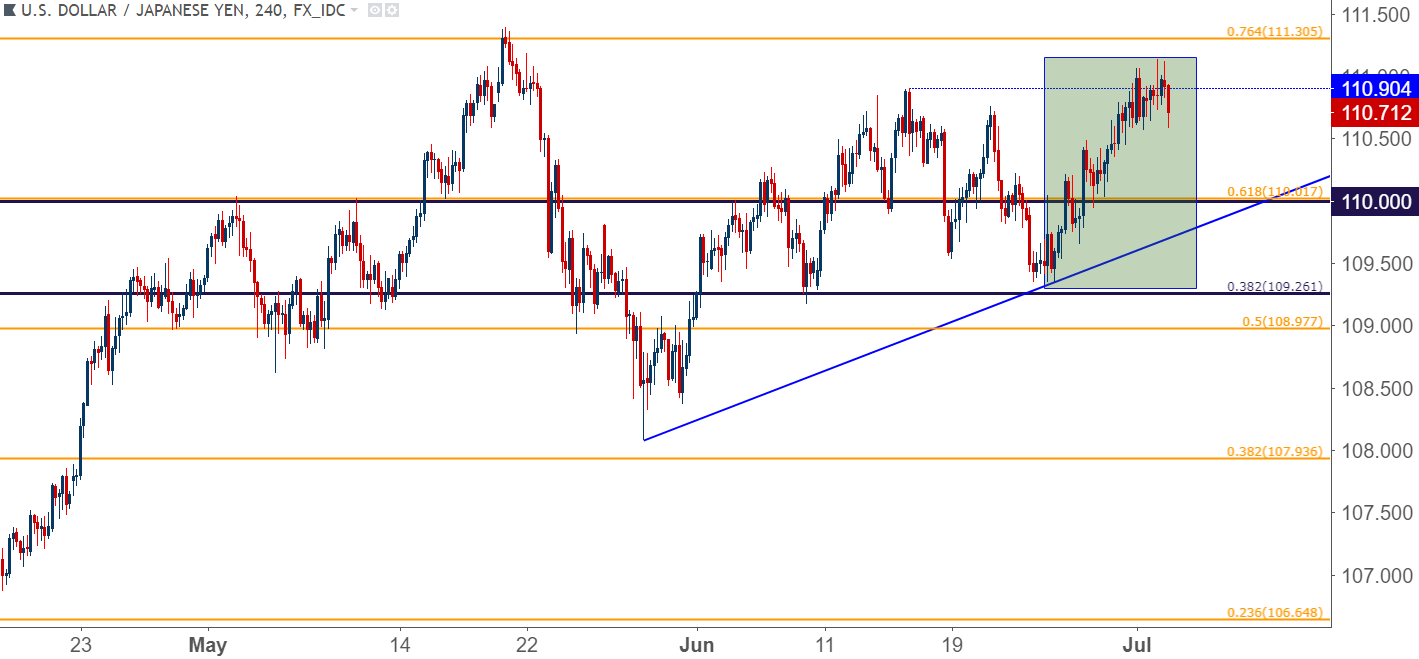
Chart prepared by James Stanley
The big question around the Yen as we move deeper into Q3 is likely tied to a larger question of overall global risk aversion. As risk aversion showed-up in the first half of 2018, Yen strength came along with it. That theme remained fairly pronounced through Q1, and last quarter was very much a reversal of that theme, as 76.4% of the Q1 down-trend was erased in Q2. This keeps the pair in a bullish spot as we move deeper into the year, with particular emphasis on defense of the area round 108.98, which is the 50% retracement of the Q1 sell-off in USD/JPY.
USD/JPY Eight-Hour Chart
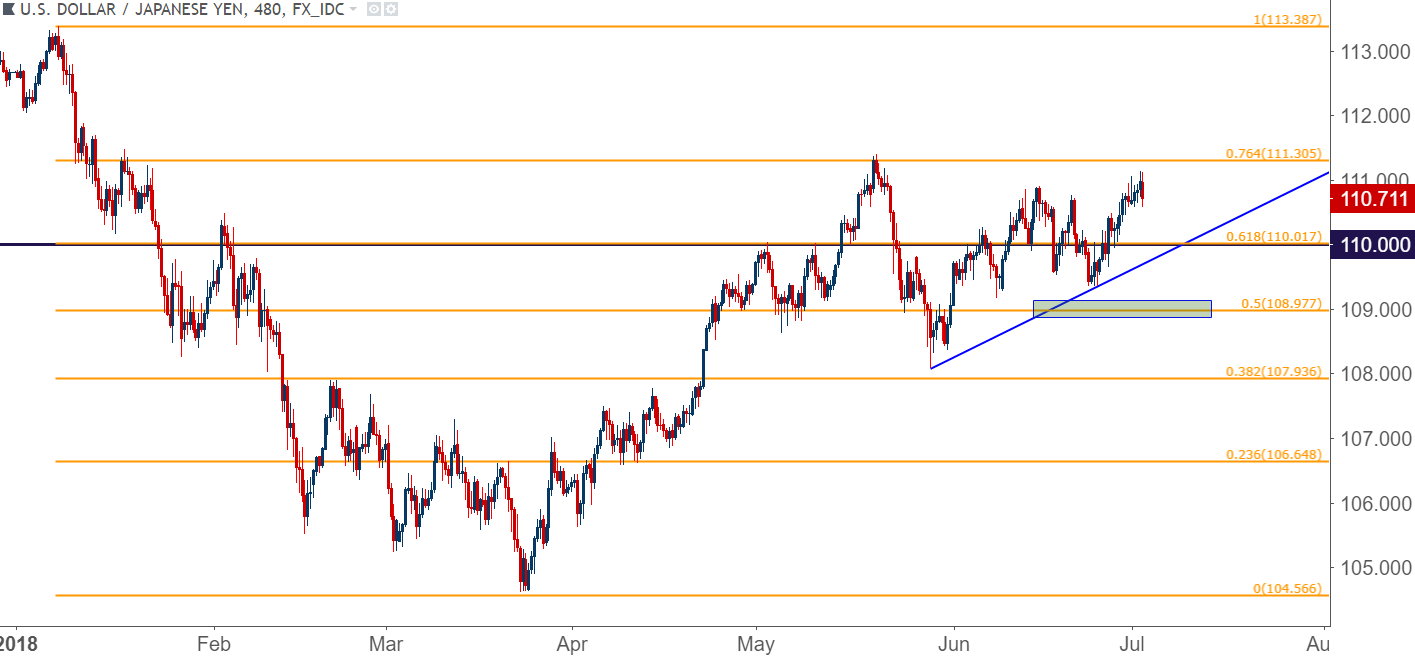
Chart prepared by James Stanley
US Stocks Reverse Early Losses to Start Q3
Yesterday’s session opened with selling across US equities, and this was somewhat of a continuation of the volatility that had showed across US indices in the first half of 2018. But, as we’ve seen a few times in the recent past, earlier gap-losses were recovered and US stocks closed yesterday’s session in the Green. The big question across US stocks as we move into the second-half of the year is whether the volatility that showed in Q1 and lasted through Q2 was a blip on the radar, or a sign of things to come.
In the S&P 500, prices continue to work within the confines of the Fibonacci retracement produced from the February sell-off. The 50% marker of that move at 2703 has been helping to set support over the past two weeks, while we also have potential short-term resistance at prior support, or the 61.8% retracement of that move.
SPX500 Daily Chart: Continues to Work Within Confines of February Fibonacci Retracement

Chart prepared by James Stanley
The Dow Jones Industrial Average looks a bit less enthusiastic, as prices are coming off of fresh seven-week lows that were established just last week. The prior support zone that runs from 24,384-24,522 has been helping to set resistance over the past week, and this highlights the potential for a deeper move of weakness before the longer-term bullish trend might become attractive again.
The area that we’ve been following for potential top-side resumption comes-in off of a trend-line produced from the earlier-year swing-lows, taken from February, April and May lows. If prices finally are able to find some element of lasting support at this area, the door can re-open for bullish strategies. Until then, there remains bearish short-term potential in the index.
Dow Jones Daily Chart: Resistance at Prior Zone of Fibonacci Support, Trend-Line Support Potential

Chart prepared by James Stanley
To read more:
Are you looking for longer-term analysis on the U.S. Dollar? Our DailyFX Forecasts for Q1 have a section for each major currency, and we also offer a plethora of resources on USD-pairs such as EUR/USD, GBP/USD, USD/JPY, AUD/USD. Traders can also stay up with near-term positioning via our IG Client Sentiment Indicator.
Forex Trading Resources
DailyFX offers a plethora of tools, indicators and resources to help traders. For those looking for trading ideas, our IG Client Sentiment shows the positioning of retail traders with actual live trades and positions. Our trading guides bring our DailyFX Quarterly Forecasts and our Top Trading Opportunities; and our real-time news feed has intra-day interactions from the DailyFX team. And if you’re looking for real-time analysis, our DailyFX Webinars offer numerous sessions each week in which you can see how and why we’re looking at what we’re looking at.
If you’re looking for educational information, our New to FX guide is there to help new(er) traders while our Traits of Successful Traders research is built to help sharpen the skill set by focusing on risk and trade management.
--- Written by James Stanley, Strategist for DailyFX.com
Contact and follow James on Twitter: @JStanleyFX


