


Talking Points:
- There’s a number of high-impact drivers on the economic calendar for this week as we move towards the end of Q2 and the first-half of 2018. We have high-impact USD data every day for the remainder of this week, and Europe takes the spotlight on the latter-portion of the calendar as a set of key inflation prints out of Germany (Thursday) and the Euro-Zone (Friday) will receive considerable focus after the ECB’s dovish outlay earlier in the month.
- US stocks remain under pressure and this has been a rather continuous theme since the Fed’s rate hike earlier the month. We looked into the Dow Jones Industrial Average earlier this morning, watching for a bullish trend-line taken from the February, April and May lows to come into play after prices broke below a big zone of support yesterday.
- DailyFX Forecasts on a variety of currencies such as the US Dollar or the Euro are available from the DailyFX Trading Guides page. If you’re looking to improve your trading approach, check out Traits of Successful Traders. And if you’re looking for an introductory primer to the Forex market, check out our New to FX Guide.
Do you want to see how retail traders are currently trading the US Dollar? Check out our IG Client Sentiment Indicator.
US Dollar Bounces From Fibonacci Support Zone
The US data for this week gets underway this morning with the release of US consumer confidence numbers for the month of June, and after this morning, we get high-impact US data every day for the remainder of this week. This week marks the final week of Q2, so we also have the potential for quarter-end flows to show-up through price action, and this can often bring counter-trend movements to what were some of the more prominent themes in the closing quarter.
DailyFX Economic Calendar: High-Impact USD Data for Week of June 25, 2018
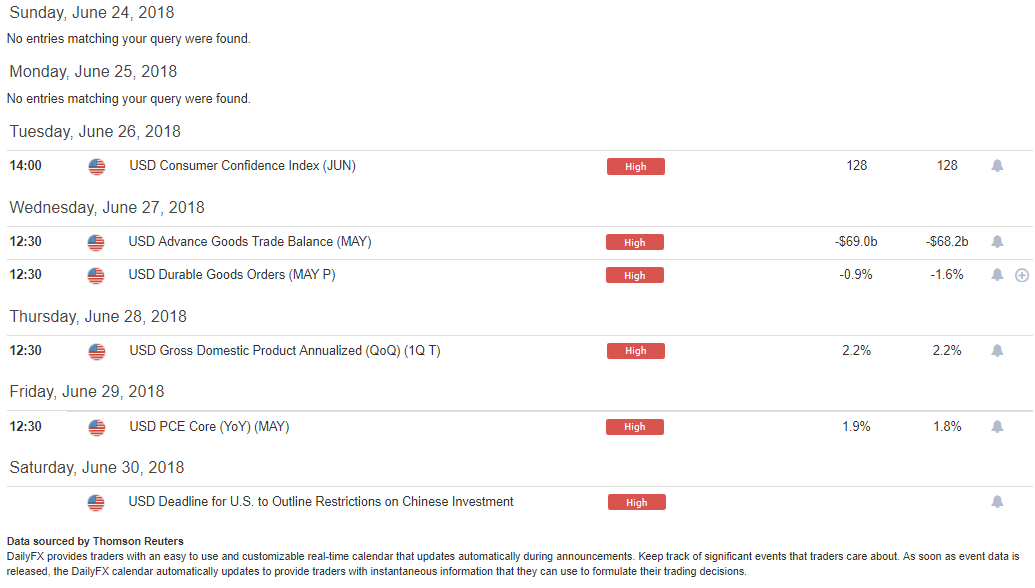
Chart prepared by James Stanley
One of those prominent themes in Q2 has been a return of US Dollar strength after a year-plus hiatus. The Dollar began trending lower in January of last year, and that theme of weakness largely remained into the second quarter of this year. A bit of Fibonacci support had shown in the Greenback in February, but bulls were unable to do much with it until the ECB rate decision in April. As the ECB went dovish, largely in response to lagging inflation and slowing economic data, EUR/USD dropped and the US Dollar started to catch a bid. The month of May saw European political risk re-enter the equation after the events in Italy, and that risk remains; but the big factor of capitulation appeared around the European Central Bank’s June rate decision. This is when the ECB finally announced details behind their strategy to exit stimulus, but while doing so also said that they anticipate rates staying at current levels ‘at least through the summer of 2019.’
This dashed hopes for higher rates in Europe, and since then we’ve seen a bit of continuation in both of those themes: Euro weakness as rate hike bets get priced further-out into the future, and US Dollar strength as the Fed remains one of the few games in town for rate hikes from developed economies. This helped the US Dollar to set a fresh 11-month high just last week. Since then, prices have started to pullback, and yesterday we looked at an interesting support zone that runs from 94.20-94.30 on DXY. The price of 94.20 is the 38.2% retracement of the prior sell-off, and so far this level is helping to hold the lows after that pullback has started to show.
US Dollar Four-Hour Chart: Bounce From Fibonacci Support Zone After Pullback From 11-Month Highs
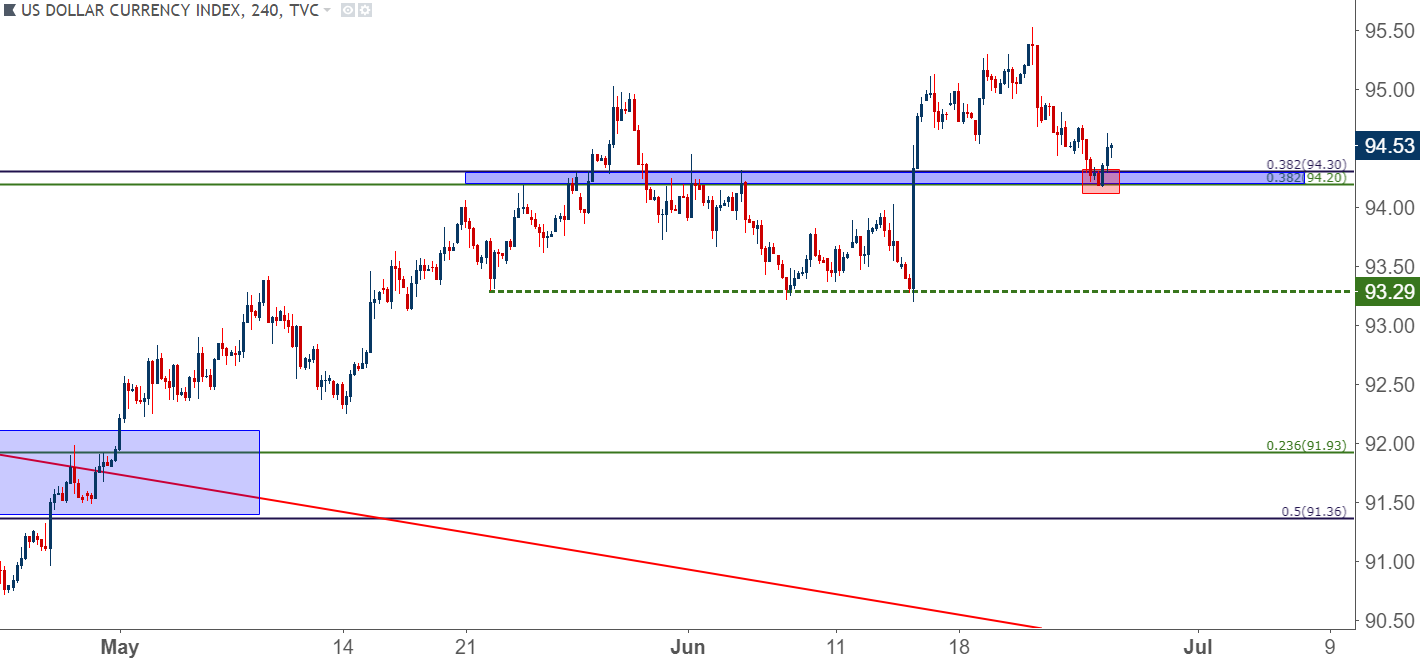
Chart prepared by James Stanley
On a longer-term basis, the US Dollar retains the potential for bullish continuation, particularly with prices remaining above the prior June swing-low around 93.30. The big question, at this point, is whether we get a deeper pullback as Q2 winds down, as traders take profits from what became an outsized move in the second quarter of this year.
As we move into Q3, the areas on DXY that remain of interest are higher on the chart. The price of 96.04 is the 50% marker of that prior sell-off, and just a big above that at 96.51 we have the July, 2017 swing-high. There’s another level of confluence around 98.00 on DXY, as we have both the 61.8% retracement of the prior sell-off to go along with the 23.6% retracement of the 2014-2017 major move.
US Dollar Daily Chart

Chart prepared by James Stanley
EUR/USD Holds Key Resistance Zone
Going along with that hold of support in the US Dollar has been a hold of resistance in EUR/USD. We’ve been following a zone in the pair that runs from 1.1685-1.1736. Each of those prices are taken from longer-term Fibonacci studies and over the past ten months, we’ve seen multiple support/resistance inflections from this area.
EUR/USD Daily Chart: Back to Key Zone of Resistance 1.1685-1.1736

Chart prepared by James Stanley
The big question at this point is whether bears re-grasp control ahead of Quarter-end. On a longer-term basis, the short-setup could be a bit clearer, as we have the prior area of resistance to use for stop placement that runs from 1.1821-1.1855. But, given the distance to that stop, short positions could be challenged over the next couple of days as we’ve seen buyers continuing to show up at higher-lows over the past few trading days.
EUR/USD Four-Hour Chart: June Swing-Highs Remain as Deeper Resistance 1.1821-1.1855
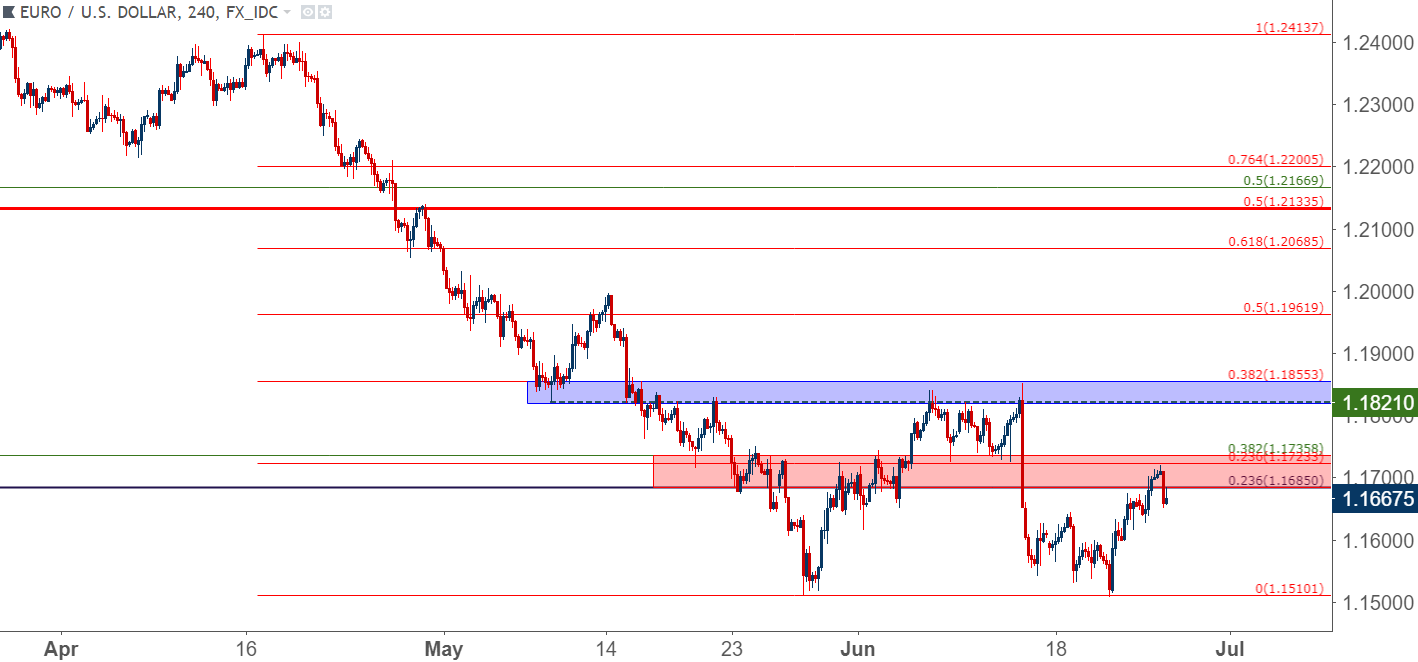
Chart prepared by James Stanley
GBP/USD
We had looked at the short-side of Cable yesterday as a long-USD candidate for this week, and the potential for bearish continuation remains. While the pair has exhibited similar overtones to EUR/USD, GBP/USD has been a bit more subdued on tests of prior resistance, and bears have seemed to be a bit more aggressive at re-entering the market. Since last Thursday, as EUR/USD has been making higher-lows, GBP/USD has held short-term resistance at the 1.3304 area, and this keeps the door open for short-side setups.
GBP/USD Four-Hour Chart: Cable Holds Resistance While EUR/USD Puts in Short-Term Higher-Lows

Chart prepared by James Stanley
USD/CHF Enters Resistance Zone
On the other side of the US Dollar, we looked at a setup in USD/CHF. Despite the fact that the Dollar has been really strong since mid-May, USD/CHF has continued to show tendencies of a bearish turn after failing to hold above the parity level. This can keep the pair as one of the more interesting short-side USD candidates or, at the very least, as an attractive instrument to hedge off long-USD risk from other setups, such as EUR/USD or GBP/USD.
USD/CHF Four-Hour Chart: Testing Lower-High Resistance Zone

Chart prepared by James Stanley
To read more:
Are you looking for longer-term analysis on the U.S. Dollar? Our DailyFX Forecasts for Q1 have a section for each major currency, and we also offer a plethora of resources on USD-pairs such as EUR/USD, GBP/USD, USD/JPY, AUD/USD. Traders can also stay up with near-term positioning via our IG Client Sentiment Indicator.
Forex Trading Resources
DailyFX offers a plethora of tools, indicators and resources to help traders. For those looking for trading ideas, our IG Client Sentiment shows the positioning of retail traders with actual live trades and positions. Our trading guides bring our DailyFX Quarterly Forecasts and our Top Trading Opportunities; and our real-time news feed has intra-day interactions from the DailyFX team. And if you’re looking for real-time analysis, our DailyFX Webinars offer numerous sessions each week in which you can see how and why we’re looking at what we’re looking at.
If you’re looking for educational information, our New to FX guide is there to help new(er) traders while our Traits of Successful Traders research is built to help sharpen the skill set by focusing on risk and trade management.
--- Written by James Stanley, Strategist for DailyFX.com
Contact and follow James on Twitter: @JStanleyFX


