


Talking Points:
- The US Dollar has rallied up to fresh 2018 highs after yesterday’s FOMC rate decision, which brought no changes to rates and largely came in-line with market expectations. Prices started to pullback after the close of the US session, and that retracement has continued through Asian and European sessions.
- Tomorrow brings Non-Farm Payrolls for the month of April, and the expectation is for a gain of +191k jobs last month. Perhaps more compelling is the Average Hourly Earnings portion of the report, and how this may impact inflation expectations after the March 2.4% CPI print out of the United States.
- DailyFX Forecasts have been updated for Q2, and are available from the DailyFX Trading Guides page. If you’re looking to improve your trading approach, check out Traits of Successful Traders. And if you’re looking for an introductory primer to the Forex market, check out our New to FX Guide.
Do you want to see how retail traders are currently trading the US Dollar? Check out our IG Client Sentiment Indicator.
US Dollar Dip and Rip Around FOMC
The rally in the US Dollar has continued in a rather interesting manner after yesterday’s FOMC rate decision, which was largely within the realm of general market expectations. Despite the lack of surprises within the Fed’s statement, the US Dollar posed a fairly quick pullback of around .5%, only to soon find support and rush up to a fresh 2018 high just a couple of hours later. Prices started to pullback (again) after the close of the US session, and that retracement has continued through Asian and European sessions with a bit of support starting to show around the 92.40 level in DXY.
US Dollar via ‘DXY’ 30-Minute Chart: FOMC-Fueled Dip Finds Bounce at 92.25
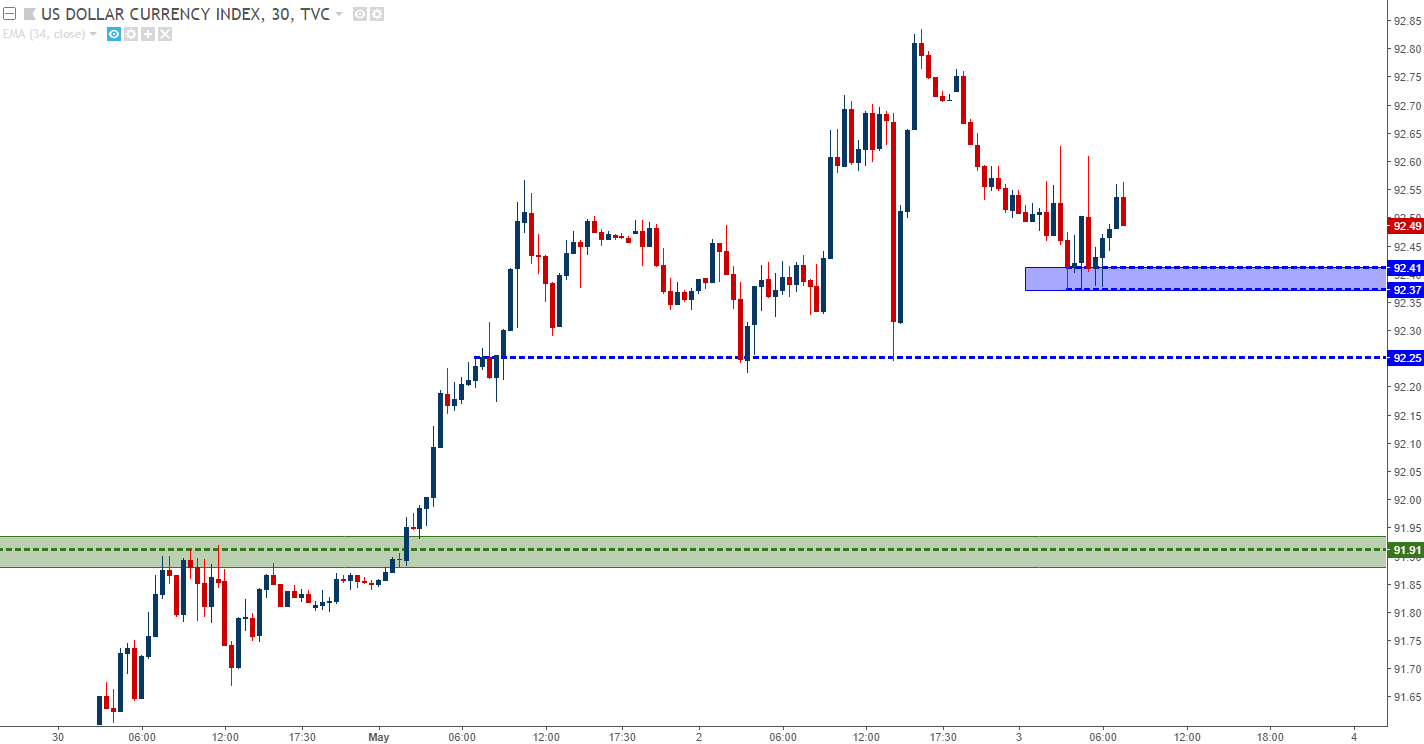
Chart prepared by James Stanley
On a longer-term basis, this helps the US Dollar to digest some recent gains after what’s become an aggressive three-week rally. DXY has gained as much as 4% from the mid-April lows, and has put in numerous bullish signals in the process. This has included the fresh 2018 highs that we looked at above, along with surging through multiple resistance levels in the process.
Yesterday we looked at how this move has become overbought on both daily and four-hour charts, and the digestion that we’ve seen since yesterday’s FOMC statement has helped to remove a bit of pressure from that theme. At this point, RSI on the daily chart appears to be moving towards a sell signal with a cross back below 70; and while this may not bring on a full-force reversal of the recent bullish trend, it does open the door to the possibility of a deeper pullback before the three week up-trend may morph into something more significant.
US Dollar Daily Chart: Making a Move From Heavy Overbought Read via RSI
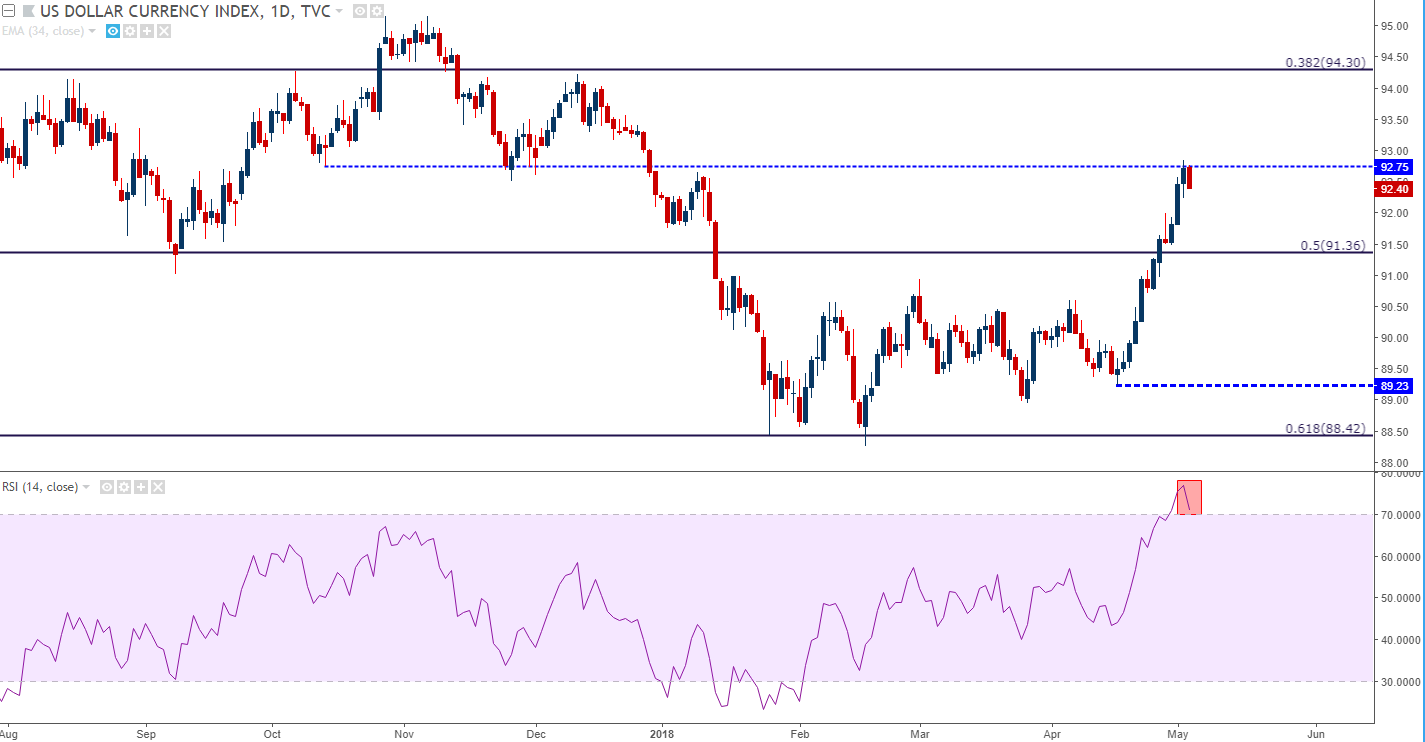
Chart prepared by James Stanley
US Dollar: The Bearish Thesis
The bearish side of the US Dollar would be looking at this recent run as a retracement in a bigger-picture down-trend. This view would be supported by the fact that not much has really changed at the Fed: The bank is still expecting an additional two hikes this year with a potential third should the backdrop provide sufficient support for additional tightening. The sell-off in the US Dollar lasted for most of 2017 and a large portion of 2018, and this was happening as the Fed was one of the few games in town as far as rate hikes were concerned. There was the building hope that rate hikes might be on the horizon out of Europe and the UK, and those expectations have diminished along with this recent rise in the Dollar, indicating that what we’re seeing is more of a deductive move as rate hike bets get priced-out of Europe and the UK.
Should NFP come out significantly below the expectation of +191k, we could see USD weakness as bets for that fourth hike from the Fed get priced-out. This could bring on a move towards support levels around 91.91 or perhaps even 91.36. Should a deeper reversal show, then support around 91.00 is exposed and a break-below that level marks a return of the ‘bigger picture’ bearish trend.
US Dollar via ‘DXY’ Hourly Chart: Holding Support Around Aggressively-Sloped Trend-Line

Chart prepared by James Stanley
US Dollar: The Bullish Thesis
Given the current overbought readings on the Daily chart, even USD bulls may want to wait for a deeper pullback before looking to chase the trend-higher. The bullish thesis around the US Dollar would largely be focusing on the monetary divergence currently taking place across major Central Banks. The Fed is openly looking to hike rates and tighten policy, while Central Banks in Europe and Japan appear to be far from the same. Even the UK appears to be backing away from rate hikes after the recent drawdown in inflation, and this would mean that the Fed is back to being one of the few games in town for rate hikes.
This view would be looking for a continuation of strength in US data, with special emphasis on inflation, to push the Fed towards that fourth hike this year while the rest of the world’s Central Banks continue with passive policy. Of particular interest for tomorrow’s NFP report will be the Average Hourly Earnings portion of the release, looking for clues of continued wage growth which often show as a precursor to market-wide inflation. We saw something similar in February around the release of January NFP’s. This is when the headline number printed with a slight beat of expectations (200k v/s 180k on the initial release), but Average Hourly Earnings brought an upside surprise, printing at 2.9%. This brought a couple of weeks of USD-strength before the currency was slammed down to a fresh three-year low.
This exposes a potential move up towards 94.30, which is a confluent area on DXY charts. The 38.2% Fibonacci retracement of the 2014-2017 major move comes in at 94.30, and the 38.2% retracement of the 2017-2018 down-trend comes-in at 94.28. This could become an ideal target for topside plays looking for a continuation of this recent strength. The 50% level from the longer-term move at 91.36 could be an ideal area to look for higher-low support to work with continuation of the trend.
US Dollar Weekly Chart
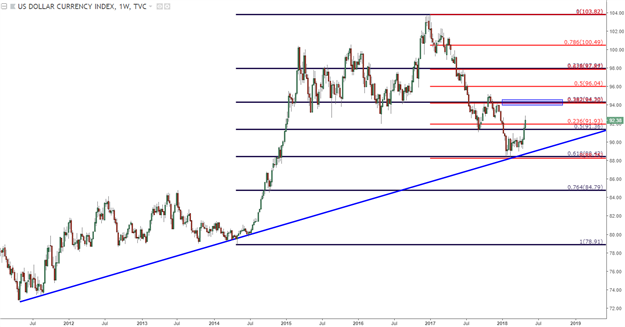
Chart prepared by James Stanley
For USD-Strength Plays, Look to Commodity Currencies
If we are seeing a legitimate shift of the longer-term trend, US Dollar strength against commodity currencies is a theme that may stay as attractive. A stronger Dollar appears to be very much aligned with continued strength in inflation, and that’s something that will generally hit commodities; and commodity currencies will often take a trip along for the ride.
As Dollar-strength was getting priced-in over the previous few weeks, commodity currency-pairs showed that theme quite visibly while the Euro and British Pound have been confined to fits and starts based around headline risk. The move in commodity currency-pairs was rather clean, and has only recently started to pullback.
We’d previously looked at a short-side setup in NZD/USD, and after a test below the psychological level of .7000 earlier this week, prices are pulling back. This exposes a number of potential levels for lower-high resistance, including a swing high around .7095 and a prior area of support around .7150.
NZD/USD Four-Hour Chart
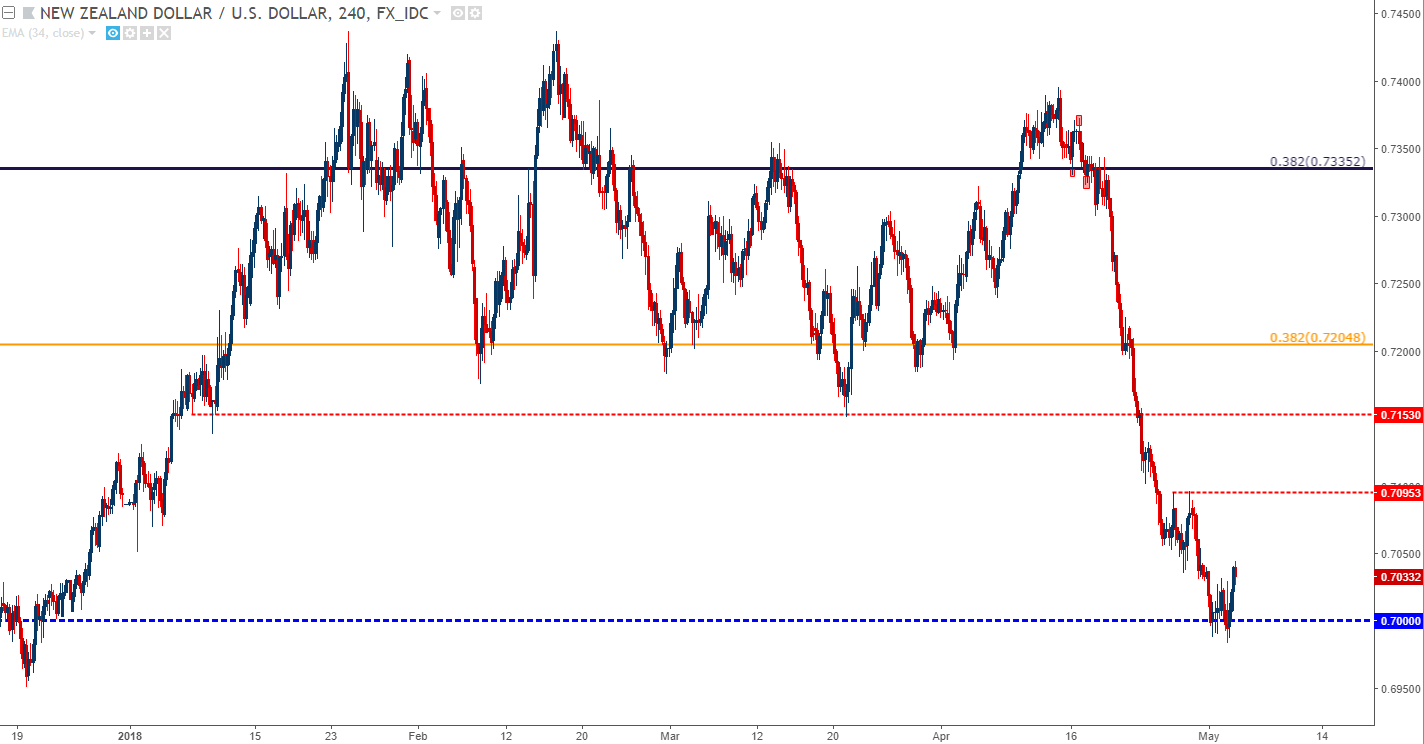
Chart prepared by James Stanley
For a Reversal of USD-Strength, Look to Reversals in EUR/USD and GBP/USD
The moves that have shown over the past couple of weeks in EUR/USD and GBP/USD have been aggressive, and there’s been a rather logical driver behind each. Falling rates of inflation have opened the door for each respective Central Bank to get a little more dovish, and this has helped to bring retracement/reversal into themes that have been getting baked-in for well-over a year.
The big question is whether April was a game-changer for those prior trends of strength. While it’s possible that trends that have been getting priced-in for well-over a year might just turn-around and go in the other direction, we have to adhere to the observation that we’re seeing a mere two/three weeks of weakness after more than a year of strength.
Both EUR/USD and GBP/USD are grasping on to key support levels, and neither is particularly bullish at the moment. But – if we do see these supports hold, followed by an initial return of strength around tomorrow’s Non-Farm Payrolls, the door opens for reversal plays as we move into next week.
GBP/USD Daily Chart: Grasping on to Support at Prior Swing-Highs, RSI Deep Oversold
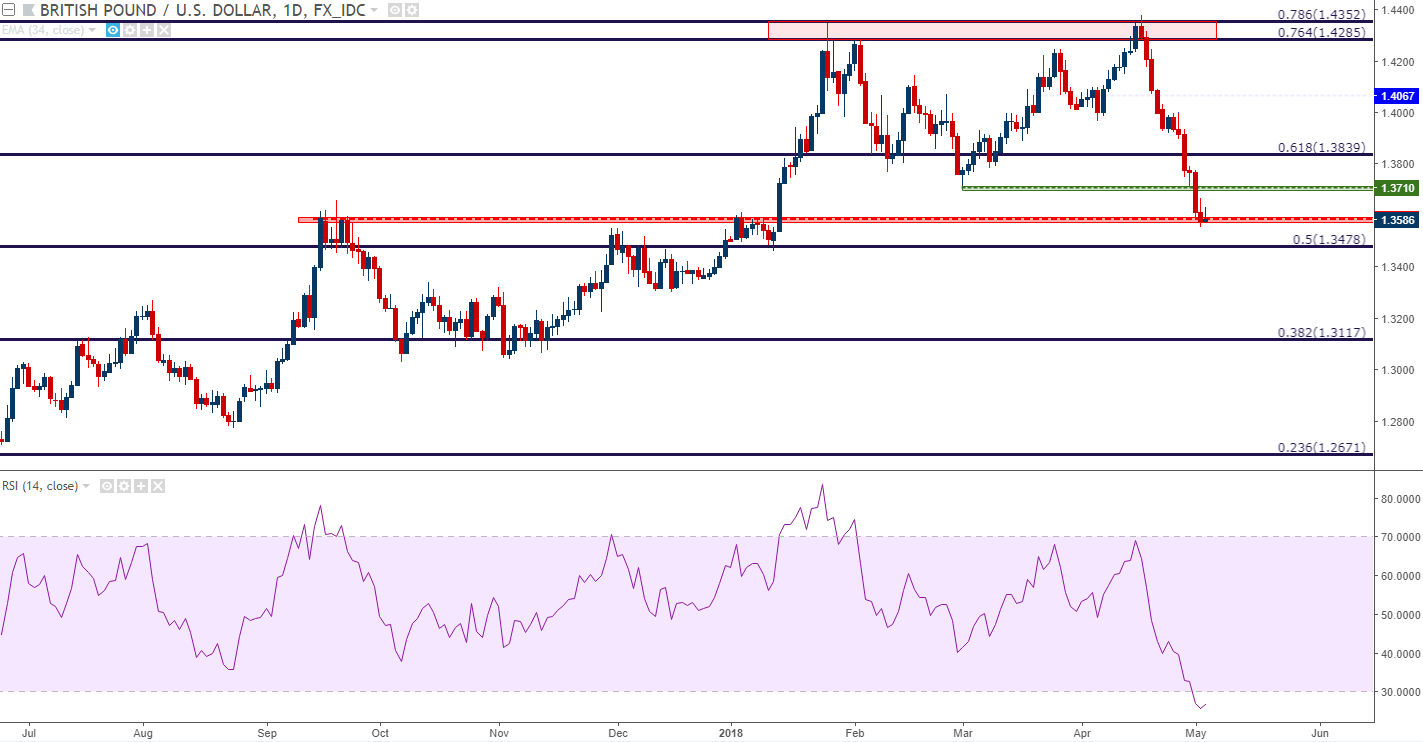
Chart prepared by James Stanley
In EUR/USD, support has slipped below the psychological 1.2000 level, and we’ve even seen a quick element of short-term resistance. This keeps the pair in a bearish stance, and for those looking to buy, a sustained break back-above 1.2000 could re-open that door. The fact that the pair has not set a fresh after this morning’s disappointing inflation data would indicate that much of this move may have already run its course; and for a deeper break we’ll likely need some supporting data out of the US, namely something to keep prodding rate-hike bets higher.
EUR/USD Daily Chart: Oversold and Finding Intra-Day Resistance at 1.2000 Level
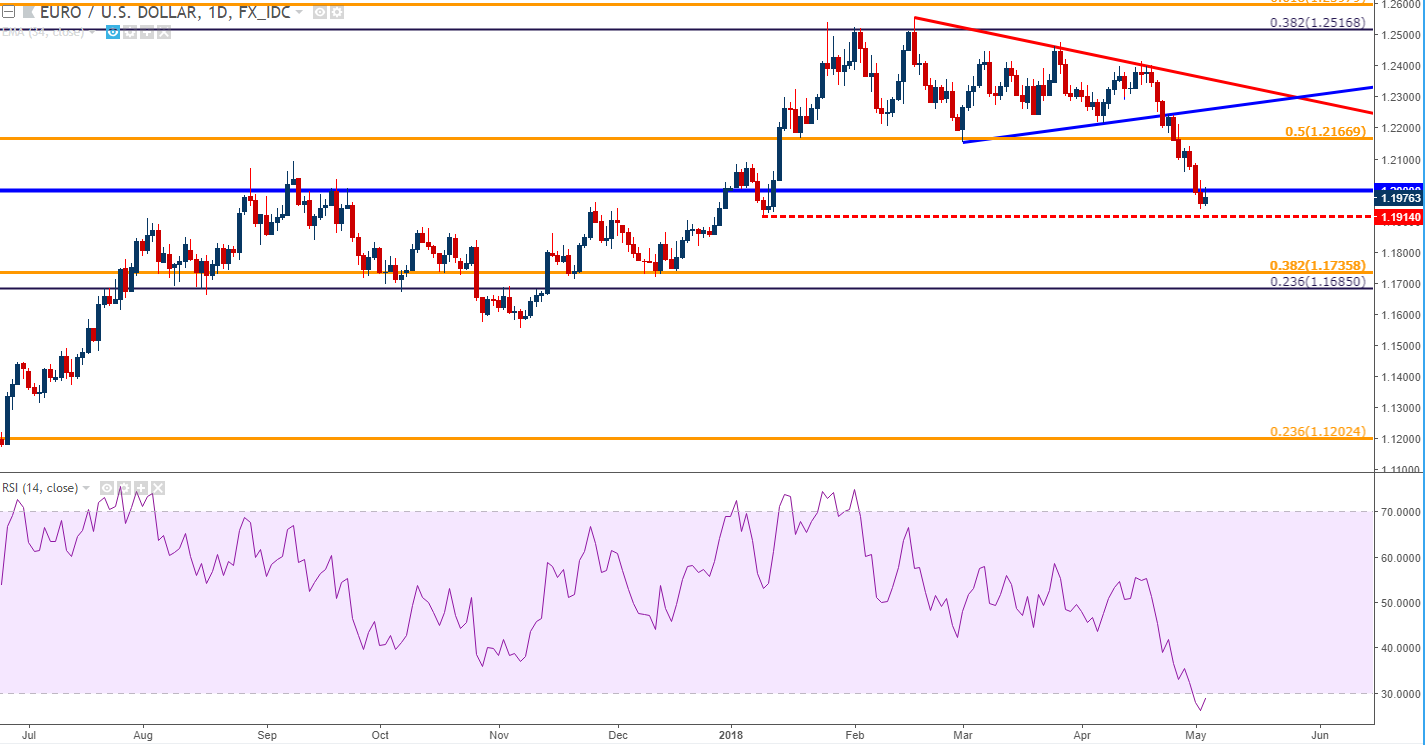
Chart prepared by James Stanley
To read more:
Are you looking for longer-term analysis on the U.S. Dollar? Our DailyFX Forecasts for Q1 have a section for each major currency, and we also offer a plethora of resources on USD-pairs such as EUR/USD, GBP/USD, USD/JPY, AUD/USD. Traders can also stay up with near-term positioning via our IG Client Sentiment Indicator.
Forex Trading Resources
DailyFX offers a plethora of tools, indicators and resources to help traders. For those looking for trading ideas, our IG Client Sentiment shows the positioning of retail traders with actual live trades and positions. Our trading guides bring our DailyFX Quarterly Forecasts and our Top Trading Opportunities; and our real-time news feed has intra-day interactions from the DailyFX team. And if you’re looking for real-time analysis, our DailyFX Webinars offer numerous sessions each week in which you can see how and why we’re looking at what we’re looking at.
If you’re looking for educational information, our New to FX guide is there to help new(er) traders while our Traits of Successful Traders research is built to help sharpen the skill set by focusing on risk and trade management.
--- Written by James Stanley, Strategist for DailyFX.com
To receive James Stanley’s analysis directly via email, please SIGN UP HERE
Contact and follow James on Twitter: @JStanleyFX


