


Talking Point:
- While both the US Dollar and EUR/USD remain mired in multi-month ranges, GBP/USD has posted a continuation of the bullish breakout from earlier in April. Prices continue to trend-higher, and are now nearing the 2018 high at 1.4346. UK inflation is on deck for Wednesday, and this is the last inflation print that we’ll see before the Bank of England’s ‘Super Thursday’ rate decision in May.
- Yen-weakness has continued to show as the currency continues to give-back strength from February and March. This could make the Yen as an interesting counter-party for bullish trends in the Euro or British Pound. We looked at the topside of GBP/JPY last week, and this morning we take another look at bullish continuation potential in EUR/JPY.
- DailyFX Forecasts have been updated for Q2, and are available from the DailyFX Trading Guides page. If you’re looking to improve your trading approach, check out Traits of Successful Traders. And if you’re looking for an introductory primer to the Forex market, check out our New to FX Guide.
Do you want to see how retail traders are currently trading the US Dollar? Check out our IG Client Sentiment Indicator.
US Dollar Kicks Off the Week by Running Back to Support
Last week saw near-term Dollar weakness continue after the disappointing NFP report from the Friday before. DXY made a late-week attempt to re-test the 90.00 level, but even that fell flat as sellers came in ahead of that potential resistance. As we open up a fresh week, the Greenback has run right back to the support zone from last week, and this is the same area that held the lows in DXY for the bulk of March.
US Dollar via ‘DXY’ Four-Hour Chart: Last Week’s Strength Runs Short of 90.00, Back to Support
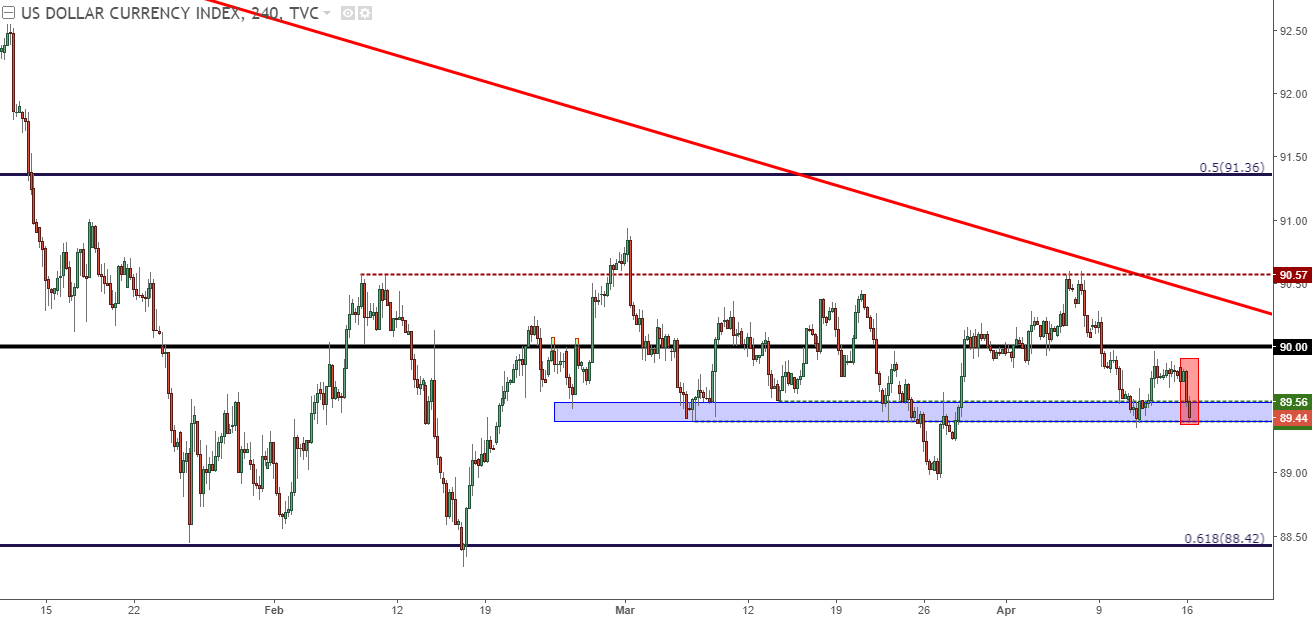
Chart prepared by James Stanley
US Dollar Range Appears Set to Continue
The US Dollar has now been range-bound for two-and-a-half months. Prices ran-lower through the first few weeks of 2018, hitting a key area of Fibonacci support, and after another test of that level in February, price action has continued to oscillate back-and-forth with range-like behavior. This move is related to the range that we’ve seen in EUR/USD, and given that DXY is comprised of a 57.6% allocation to the single currency, this relationship makes sense. As long as we see the range in the US Dollar continue, we’ll likely be seeing some element of range-bound price action showing in EUR/USD.
If support does not hold in the current zone, there are two areas below current price action that would allow for range-continuation. The next level-lower would be the swing-low from late-March, and below that we’d have the 61.8% Fibonacci retracement of the 2014-2017 major move, as this level helped to quell the USD down-trend after the January sell-off and remains as long-term support in DXY.
US Dollar Four-Hour Chart: Deeper Support Potential While Range Remains

Chart prepared by James Stanley
EUR/USD Moves Up to Resistance
Much like the US Dollar, the multi-month range remains alive and well in EUR/USD. As we open a fresh week, prices are near the resistance side of this range, making for a challenging position for bulls as we’re catching a bit of resistance below last week’s highs.
EUR/USD Four-Hour Chart: Multi-Month Range Continues
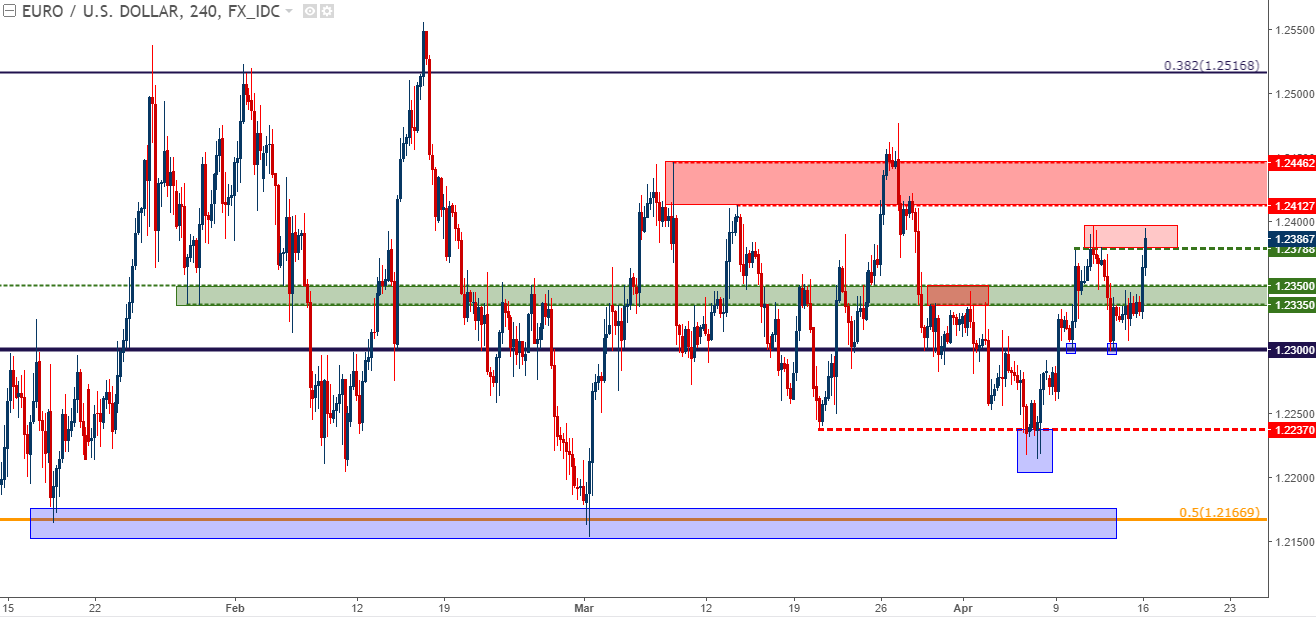
Chart prepared by James Stanley
Last week saw a bullish short-term move in EUR/USD top-out when testing resistance at 1.2375, and this lead to another support test at 1.2300 before buyers came in to perk prices up ahead of the week’s close. As we open into a fresh week, EUR/USD is finding sellers just a bit-below last week’s resistance, and this puts price in a rather unattractive spot. A bit-higher on the chart is another zone of interest for range resistance, and this runs from 1.2412-1.2446.
EUR/USD Hourly Chart: Testing Short-Term Resistance
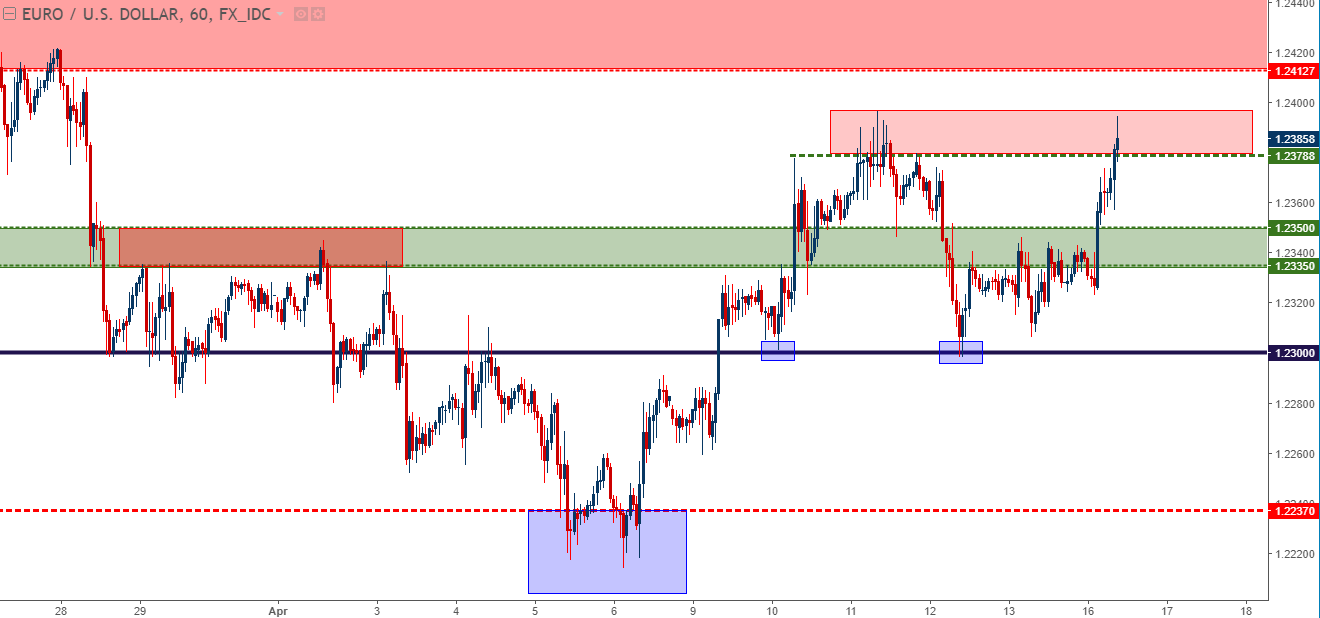
Chart prepared by James Stanley
GBP/USD Hurdles Towards 2018 Highs
One pair that is not range-bound at the moment is GBP/USD, as prices are making a fast approach towards 2018 highs. This continues a streak that’s seen six consecutive days of gains in the pair, and this comes after GBP/USD wrestled around support at the 1.4000 level around Non-Farm Payrolls.
GBP/USD Daily Chart: Prices Jump to January Resistance – Can Buyers Hold the Move?
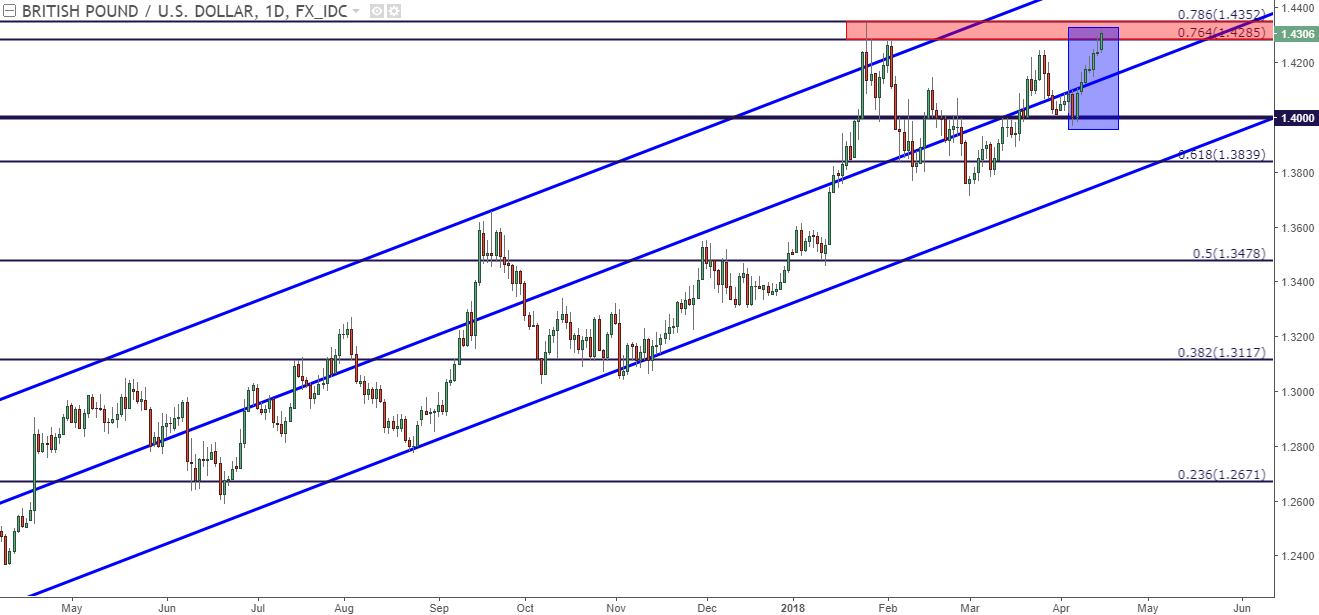
Chart prepared by James Stanley
This week brings UK inflation numbers on Wednesday, and this is the last piece of inflation data that we’ll get before the Bank of England hosts their May ‘Super Thursday’ rate decision. There’s a strong probability of getting a hike at that meeting, so this inflation print would likely need to be very nasty to hit those odds of a rate rise. The bigger question around the pair is one of positioning, as we’ve just run into an area of resistance that had previously elicited a strong reversal; and this test of resistance is happening while near-term price action is overbought.
GBP/USD Two-Hour Chart: Overbought RSI Starting to Diverge as Prices Test Resistance
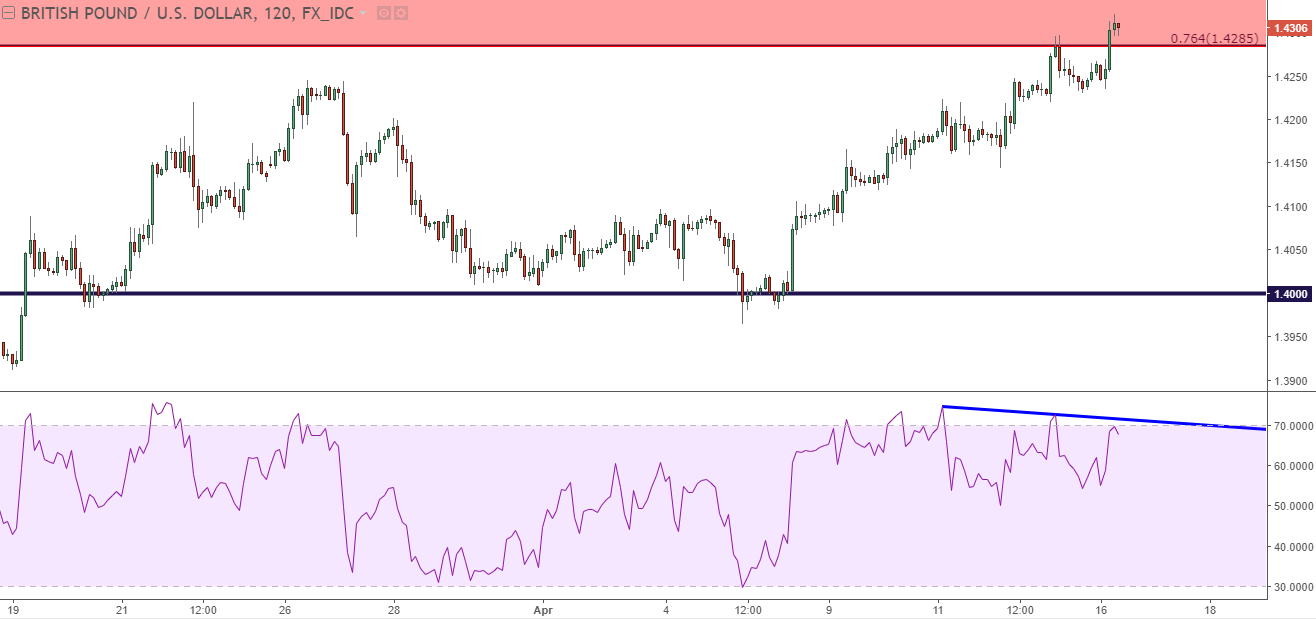
Chart prepared by James Stanley
Can USD/JPY Prod a Move of Bullish Continuation?
Also of interest this week is the potential for continuation of Yen-weakness. Yen-strength became a prominent theme in February and remained as such throughout March. But as we’ve opened into April, weakness has started to show in the currency again, and this has opened the door to the prospect of continuation. In the major pair of USD/JPY, we’ve seen tendencies of bullish continuation showing throughout the month without bulls actually coming-in to prod significantly higher-highs or lows. We did see a new monthly high last week, but buyers lost motivation before testing the February high, and prices remain in a cautiously bullish state as we open into this week.
USD/JPY Four-Hour Chart: Bullish Potential Remains

Chart prepared by James Stanley
EUR/JPY
For the above theme of Yen-weakness, the US Dollar may be a lackluster counterpart for sizing up exposure. The US Dollar has been mired in a trend of weakness for over a year now, and while the prospect of reversal or a pullback could keep USD-strength as interesting, it’s frankly far away from where we’re at right now. More interesting, however, could be matching up a currency that may have a more pronounced bias of strength, and given prior trends, the Euro may hold a bit more promise than what one may muster around the US Dollar.
We looked at a setup in EUR/JPY as one of our FX setups for this week, and as prices have opened for the period, we’ve seen strength continuing to show, keeping the door open for bullish continuation in EUR/JPY. The pair is making a move towards 133.06, which is the two-month high in the pair, and a break-above keeps the door open for more topside, with targets cast towards the 134.41 Fibonacci level.
EUR/JPY Four-Hour Chart: Bullish Continuation Potential
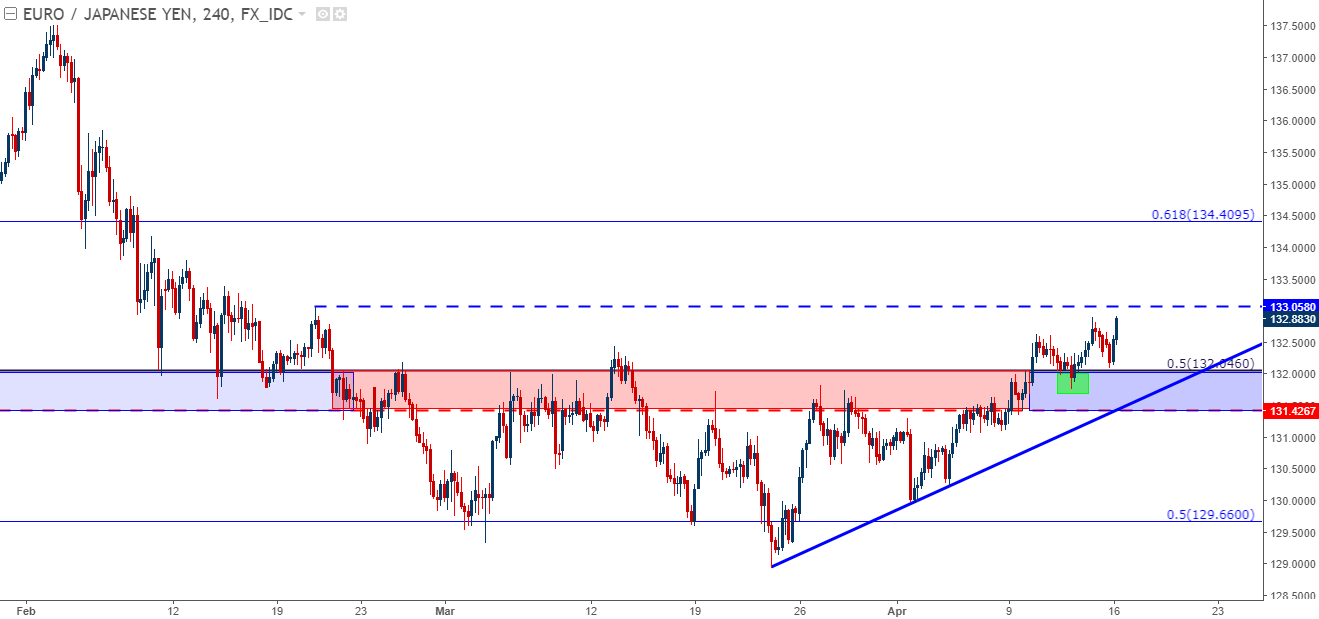
Chart prepared by James Stanley
To read more:
Are you looking for longer-term analysis on the U.S. Dollar? Our DailyFX Forecasts for Q1 have a section for each major currency, and we also offer a plethora of resources on USD-pairs such as EUR/USD, GBP/USD, USD/JPY, AUD/USD. Traders can also stay up with near-term positioning via our IG Client Sentiment Indicator.
Forex Trading Resources
DailyFX offers a plethora of tools, indicators and resources to help traders. For those looking for trading ideas, our IG Client Sentiment shows the positioning of retail traders with actual live trades and positions. Our trading guides bring our DailyFX Quarterly Forecasts and our Top Trading Opportunities; and our real-time news feed has intra-day interactions from the DailyFX team. And if you’re looking for real-time analysis, our DailyFX Webinars offer numerous sessions each week in which you can see how and why we’re looking at what we’re looking at.
If you’re looking for educational information, our New to FX guide is there to help new(er) traders while our Traits of Successful Traders research is built to help sharpen the skill set by focusing on risk and trade management.
--- Written by James Stanley, Strategist for DailyFX.com
To receive James Stanley’s analysis directly via email, please SIGN UP HERE
Contact and follow James on Twitter: @JStanleyFX


