


Talking Points:
- The S&P 500 is on the verge of a bullish breakout as we approach this morning’s US equity open, and this highlights a continuation of volatility in the equity space while many FX pairs remain relatively quiet. One FX market that was not quiet this week will remain in the spotlight for next week, as the bullish breakout in the British Pound will be in focus for Wednesday’s release of March inflation numbers out of the UK.
- Both the US Dollar and the Euro continue display range-bound characteristics, while both GBP and JPY are showing tendencies of trend. This makes for an interesting backdrop across FX-land as we move deeper into April, and we discussed a number of these pertinent themes in yesterday’s webinar entitled, FX Majors: Price Action Strategy Across USD-Pairs.
- DailyFX Forecasts have been updated for Q2, and are available from the DailyFX Trading Guides page. If you’re looking to improve your trading approach, check out Traits of Successful Traders. And if you’re looking for an introductory primer to the Forex market, check out our New to FX Guide.
Do you want to see how retail traders are currently trading the US Dollar? Check out our IG Client Sentiment Indicator.
Next Week’s Economic Calendar
Next week’s economic calendar is noticeably light on US issues, with the sole high-impact item being released ahead of Monday’s US equity open. But – there are a number of notable releases elsewhere that can drive some volatility through FX markets, with the likely highlights taking place on Wednesday. On Wednesday morning, we get inflation out of the UK for the month of March; and later in the day we get a Bank of Canada rate decision. Both GBP and CAD have been on the move of recent, and these data points could continue to prod volatility in related markets around each currency.
DailyFX Economic Calendar: High-Impact Events for Week of April 16, 2018
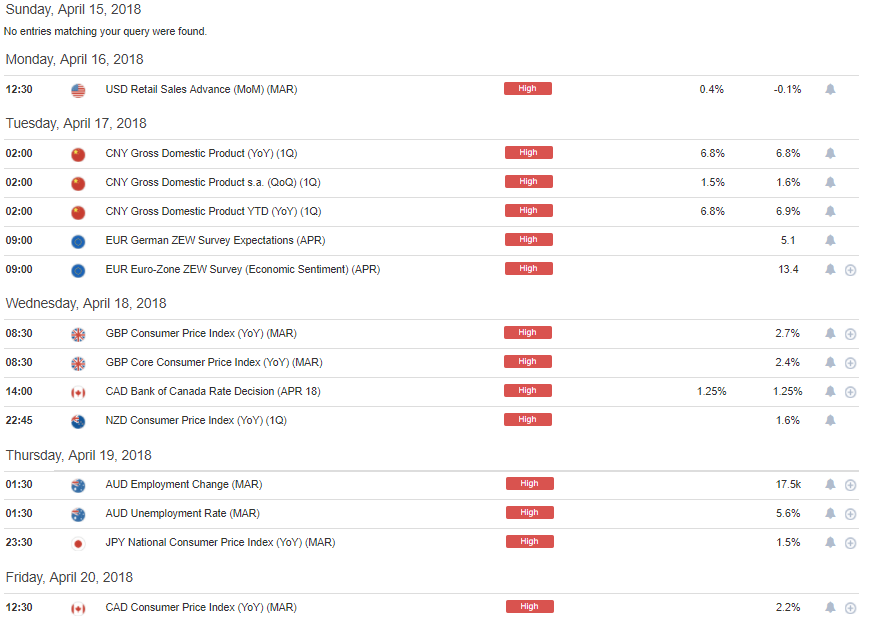
Chart prepared by James Stanley
S&P 500 Testing Resistance Ahead of Friday Open
Earlier in the week we looked at a resistance zone that’s built up over the past few weeks in the S&P 500, and this zone has held multiple upward advances so far. Normally, a resistance level of this nature could be attractive for short-side positions, but over the past couple of weeks that resistance has been coupled with the build of higher-lows, indicating that bulls are getting a bit more aggressive as the S&P 500 has tested support.
We’re now very near the top-end of that resistance zone, and as we near the Friday open, the potential for a bullish breakout remains. If this resistance zone does yield, it could lead to a sharp topside breakout, as pent up strength could become unleashed if this line-in-the-sand resistance is finally taken-out.
S&P 500 Hourly Chart: Bullish Breakout Potential as Higher-Lows Pick Up the Pace
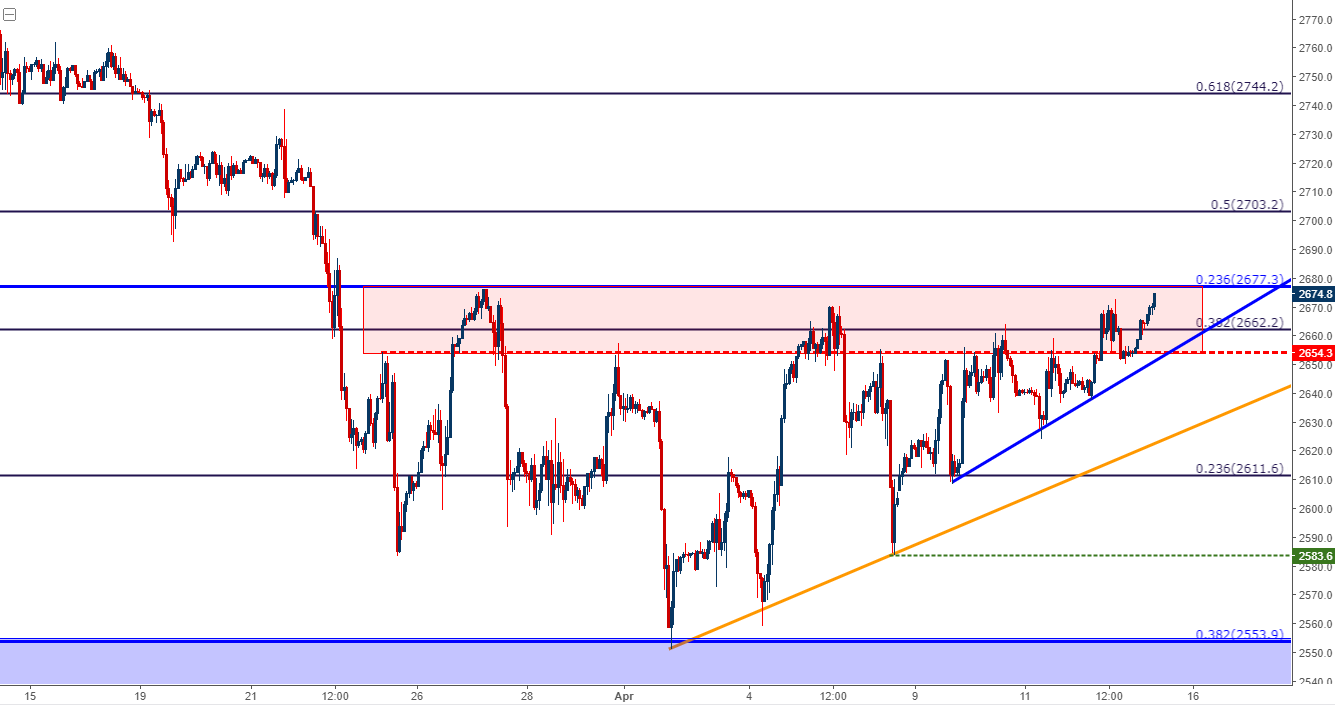
Chart prepared by James Stanley
British Pound Breakout – UK Inflation is On Deck
One area that we no longer have to wait for a bullish breakout is the British Pound. GBP/USD has been in an up-trend now for over a year. Fresh highs printed in January, and as price action started to pull back, a retracement developed that lasted through most of February. But in March, bulls started to come back into the pair, and prices were soon re-engaging the 1.4000 psychological level.
Thus far in April, that bullish trend has continued, and matters really began to heat up this week as the British Pound posed strength against almost every currency on Earth. At this point, we’re trading at fresh two-month highs and a bit of resistance has begun to show just shy of the 1.4300 psychological level. The big item of importance on the horizon for GBP is the release of UK inflation data next Wednesday. Inflation in the UK remains brisk, and the pace of price increases is such that it appears as though we’ll be getting another rate hike from the Bank of England at their next Super Thursday meeting in May.
At this stage, the case can be made that many GBP-pairs are overbought, and chasing that move as we head into a weekend could be imprudent. Rather, we can look for prices to show some element of support in order to more adequately manage risk (initial stops) as we approach that UK inflation report.
Earlier this week, we looked at support plays off of the 1.4067-1.4088 zone, followed by another higher-low area of support around 1.4145. At this stage, prices are pulling back and the area of interest for higher-low support is around 1 1.4200, as this level had functioned as a prior points f swing-high resistance. We broke through this week as strength in GBP became unleashed; but, to date, this level has not yet been tested for support.
GBP/USD Four-Hour Chart: Higher-Low Support Potential After Bullish Breakout

Chart prepared by James Stanley
GBP/JPY Breakout
While GBP/USD was surging this week, so was GBP/JPY. We looked at a couple of different topside setups, looking for higher-low support at both 150.80 and then 151.39, as each of these prices were Fibonacci levels that had displayed prior support/resistance. At this point, price action is finding a bit of resistance at the 76.4% Fibonacci retracement of the February sell-off, and traders would likely want to wait for this move to calm before looking to take on additional topside exposure. And if we do see a pullback, the areas around 152.50 and 152.17 could be usable for a continuation of fresh support at prior points of resistance.
GBP/JPY (Four-Hour Chart) Breakout Runs into Fibonacci Resistance

Chart prepared by James Stanley
Yen Weakness Continues
Going along with the above dynamics between GBP/USD and GBP/JPY has been a bullish continuation move in USD/JPY, indicating that we may have a return of Yen-weakness to work with in the coming weeks or perhaps even months. While Yen-weakness remained as a prominent theme when we walked into 2018, that scenario turned around very quickly in February as risk aversion began to show. The Yen spent most of February exhibiting some form of strength, and the prospect of a bigger-picture reversal remained as we opened the door into March.
But as we traded deeper into March, Yen strength slowly started to dissipate as bears returned, and as we’ve opened into April that Yen-weakness has become a bit more pronounced.
We’ve been following these dynamics in USD/JPY after the final week of March saw the build of lower-highs in the pair. USD/JPY broke above a bearish channel in the early stages of April, and this week saw another test of support at a prior area of resistance, and we looked at this yesterday. Since then – prices have re-ascended and are now making a fast approach towards the 107.90 swing high.
USD/JPY Four-Hour Chart: Yen-Weakness Continues as Pair Approaches Two-Month Highs

Chart prepared by James Stanley
Euro Dynamics Through the Yen
One of the complications of being long USD/JPY is being long USD. Dollar weakness has been quite pronounced over the past year-plus, and there is a case to be made for a short-squeeze type of scenario in the Greenback; but trading a continuation of Yen weakness in a US Dollar that appears to be juggling its own themes could be a rough way of looking to gain exposure into Yen-weakness.
Instead, we’ve been looking at GBP/JPY and EUR/JPY to do so. As we looked at above, the bullish breakout has already taken place in GBP/JPY, but in EUR/JPY, matters are far less developed.
This week saw prices re-climb above a key zone of prior support/resistance in the pair. This zone runs from 131.43-132.05, and this area offered support for the final four months of 2017. When the Yen-reversal began to show in February, this area came back as support, and as the pair grinded around those lower levels throughout the month, sellers finally had their way as they were able to invoke a push down to fresh five month lows at 129.00.
That Yen-weakness coming back in the final week of March, and continuing in the first couple weeks of April have helped the pair to re-ascend above this zone, and yesterday saw some support play out at this key area.
EUR/JPY Four-Hour Chart: Support Becomes Resistance Becomes Support Again
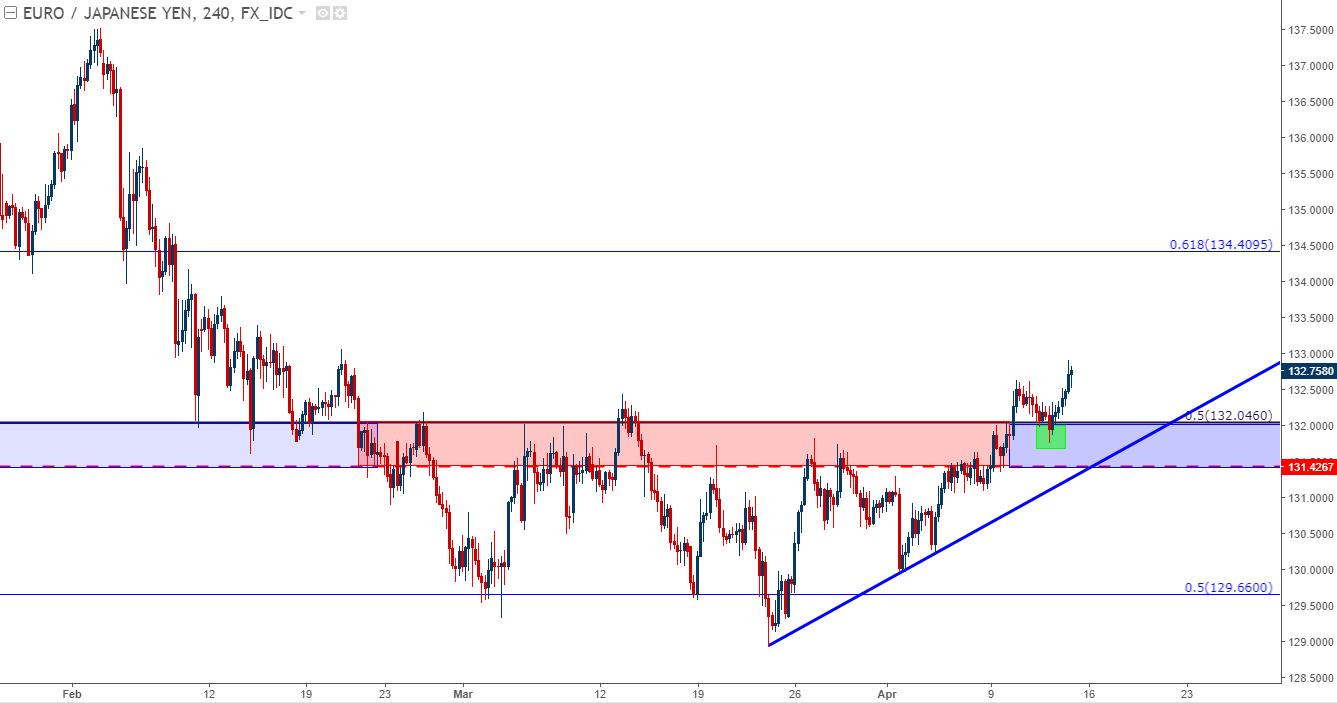
Chart prepared by James Stanley
This keeps the door open for topside in the pair, and for those looking at bullish exposure in the Euro, this may be a more attractive option than EUR/USD, which remains range-bound as we move into next week.
To read more:
Are you looking for longer-term analysis on the U.S. Dollar? Our DailyFX Forecasts for Q1 have a section for each major currency, and we also offer a plethora of resources on USD-pairs such as EUR/USD, GBP/USD, USD/JPY, AUD/USD. Traders can also stay up with near-term positioning via our IG Client Sentiment Indicator.
Forex Trading Resources
DailyFX offers a plethora of tools, indicators and resources to help traders. For those looking for trading ideas, our IG Client Sentiment shows the positioning of retail traders with actual live trades and positions. Our trading guides bring our DailyFX Quarterly Forecasts and our Top Trading Opportunities; and our real-time news feed has intra-day interactions from the DailyFX team. And if you’re looking for real-time analysis, our DailyFX Webinars offer numerous sessions each week in which you can see how and why we’re looking at what we’re looking at.
If you’re looking for educational information, our New to FX guide is there to help new(er) traders while our Traits of Successful Traders research is built to help sharpen the skill set by focusing on risk and trade management.
--- Written by James Stanley, Strategist for DailyFX.com
To receive James Stanley’s analysis directly via email, please SIGN UP HERE
Contact and follow James on Twitter: @JStanleyFX


