


Talking Points:
- Last week saw a number of interesting items after the Federal Reserve hiked rates for the first time in 2018. While the bank remains relatively hawkish, forecasting another two 25 basis point hikes this calendar year, the US Dollar remains as one of the weakest major currencies. This highlights the fact that there’s another significant push-point here, likely emanating from concerns around fiscal policy.
- A sinking US Dollar is helping to lift most major pairs, with the notable exception of the dynamics in USD/JPY, where the Yen is actually weaker than the US Dollar after last week’s bearish breakout. This highlights a number of interesting themes as we move into this week, which is a holiday-shortened week with Good Friday on the calendar. Also of note, this is the final week of Q1, so we’ll be seeing both month-end and quarter-end flows take place this week.
- Are you looking to improve your trading approach? Check out Traits of Successful Traders. And if you’re looking for an introductory primer to the Forex market, check out our New to FX Guide.
If you’re looking for short-term indicators around the US Dollar, check out our IG Client Sentiment Indicator.
This Week’s Economic Calendar is Short and Relatively Light
This week’s calendar quiets from the Central Bank-heavy outlays of the past few weeks. Friday is a holiday across many markets in observance of Good Friday, and this is the final week of the first quarter of 2018, so despite the quieter docket, the potential for volatility remains strong. The apex of activity for this week appears set for Thursday morning, as this is when we’ll get German unemployment numbers, Canadian GDP and then the Fed’s preferred inflation gauge, PCE out of the United States.
DailyFX Economic Calendar, High-Impact Events, Week of March 25, 2018

Chart prepared by James Stanley
S&P Rallies After Friday’s Late-Session Sell-Off, Close at the Lows
Last week closed in a rather nasty manner for equity bulls, as an aggressive bout of selling in the final two hours of trading pushed the S&P 500 to fresh March lows. Equity futures have shown a bullish tonality since futures opened last night, and it looks as though US stocks are going to start this week by clawing back a portion of those losses. The big question here is what happens at resistance, as the move so far appears to be corrective in nature. There’s a point of interest nearby around 2645, as this was the March low until last week saw sellers take it out.
If you’re looking for short-term indicators around SPX, check out our IG Client Sentiment Indicator.
S&P 500 Four-Hour Chart: Bounce From Friday’s Close at the Lows

Chart prepared by James Stanley
US Dollar Drops to Fresh March Lows
On Friday, we looked at the US Dollar moving back to support in the wake of the rate hike from the Federal Reserve earlier in the week. The Fed hiked rates on Wednesday while warning that more were on the way, and the US Dollar has continued to sell-off since then, displaying on a brief pause in the downtrend as we closed out last week. But as this week opened for trading, Dollar bears were back to drive the USD below support to fresh March lows, and this has helped to lift stock prices after the aggressive sell-off that showed in the final two hours of Friday trading.
US Dollar Breaks Support, to Fresh March Lows After FOMC

Chart prepared by James Stanley
This support break combined with the pervasive weakness in the currency, even when the Federal Reserve remains one of the more-hawkish Central Banks across the global landscape, highlights the bigger-picture trend in the Greenback. This also alludes to the fact that there is something else driving here, as price action has become quite divorced from monetary policy. We’ve discussed why this might have been the case previously, but the ‘what’ here is far more important than the ‘why’.
The US Dollar sold-off by as much as 15% from the 2017 high down to the 2018 low. A bit of support began to show in January, and held in February as that longer-term trend made a deeper move. This support is showing at the 61.8% Fibonacci retracement of the 2014-2017 major move in DXY and, thus far, this price has helped to hold the lows. With USD bears on the way back after last week’s rate hike, the big question is what happens here upon a re-test? Can buyers hold the line again? Or, will we see sellers take-over on a another support test to help push prices down to fresh lows?
US Dollar Weekly Chart: 61.8% Fibonacci Retracement Holds the 2018 Lows, For Now
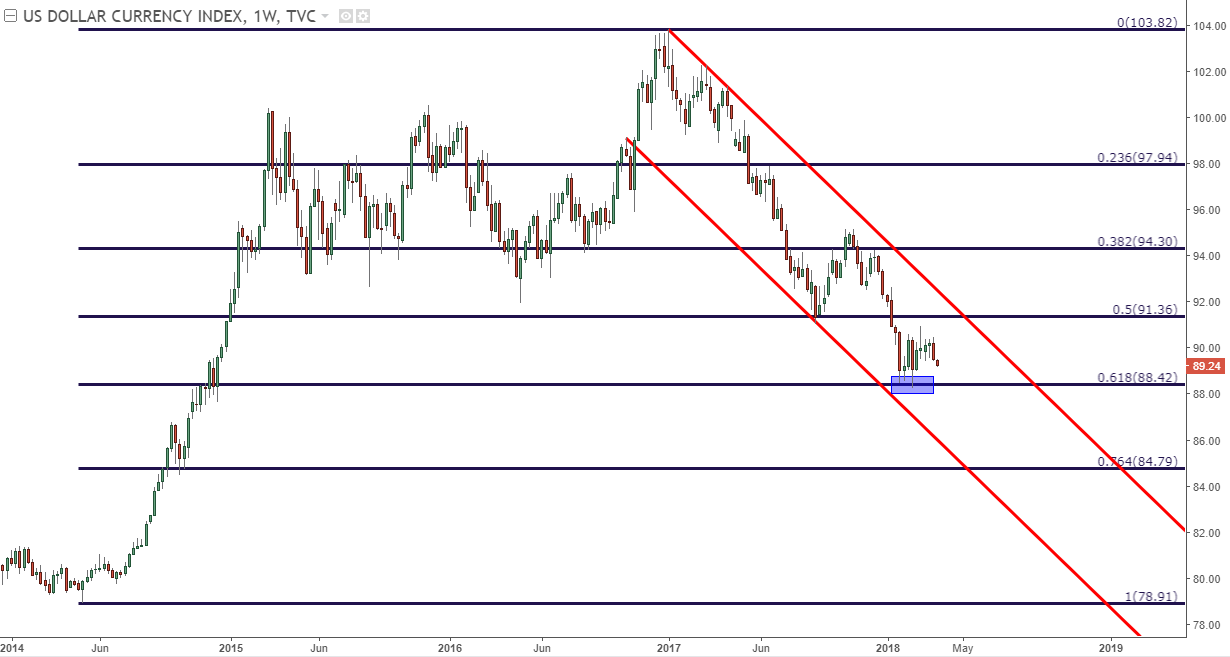
Chart prepared by James Stanley
EUR/USD: Bullish Break of Wedge Finds Resistance at 1.2400
A falling US Dollar is helping to lift most major pairs this morning, and EUR/USD has put in a bullish break of the wedge formation that we were looking at last week. A bit of resistance has started to show in a familiar area, around the 1.2400 psychological level. For those looking to get long, a pull back to support in the area from 1.2335-1.2350 could open the door to bullish continuation in the pair.
If you’re looking for short-term indicators around EUR/USD, check out our IG Client Sentiment Indicator.
EUR/USD Hourly Chart: Bullish Break of Wedge, Resistance Shows at March Swing Highs

Chart prepared by James Stanley
British Pound Poised to Re-Test 2018 Highs
The past two weeks have seen quite a bit of strength in the British Pound, and this is part of a theme that’s been going on for most of March. As we came into this month, GBP/USD was continuing to sell-off after setting a fresh post-Brexit high in January. This had helped to craft a bearish trend-line after multiple points of resistance showed at lower-highs. But two weeks ago saw a bullish breakout in the pair, and after a check of support at that prior trend-line of resistance, bulls came back in a very big way to help push prices back towards 2018 highs.
At this stage, the group of lower-highs from January/February loom ominously on the chart as longer-term resistance. These points of resistance come in around the 78.6 and 76.4% retracements of the ‘Brexit move’ in the pair.
If you’re looking for short-term indicators around GBP/USD, check out our IG Client Sentiment Indicator.
GBP/USD Daily Chart: Bulls Are Back in the British Pound, 2018 Highs as Resistance
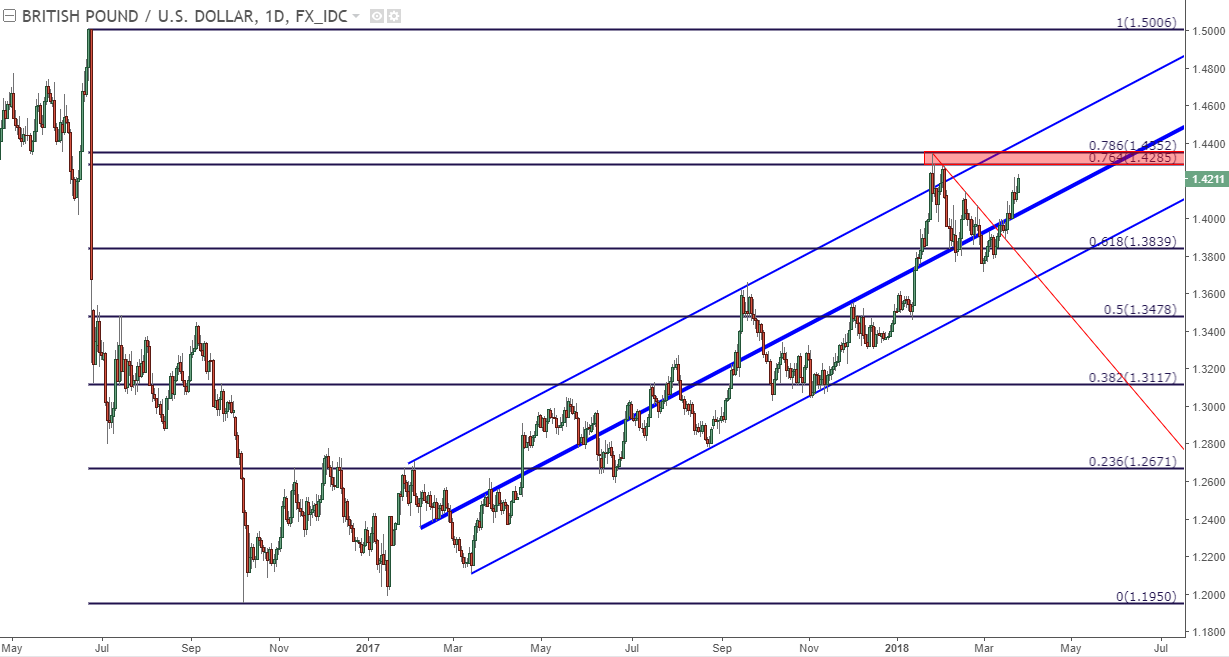
Chart prepared by James Stanley
USD/JPY Pulls Back After Bearish Breakout
One area that is not seeing USD-weakness this morning in USD/JPY. The pair is pulling back after last week’s bearish breakout took place at a big level, and the door remains open for continuation here as we move deeper into this week.
If you’re looking for short-term indicators around USD/JPY, check out our IG Client Sentiment Indicator.
USD/JPY Weekly Chart: Bearish Breakout Below a Big Area of Confluent Support Last Week
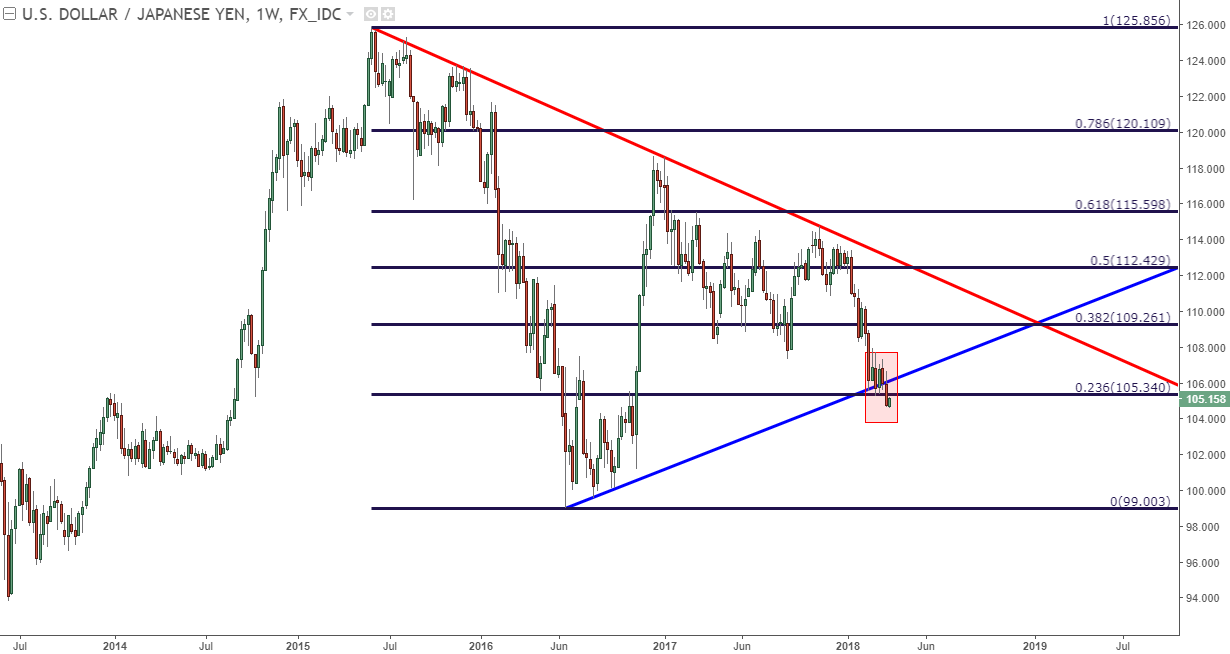
Chart prepared by James Stanley
As we open into a fresh week, the big question around USD/JPY is one of resistance. Will one of these areas of prior interest help to bring sellers back into the pair? On the below chart, we’re looking at three potential areas for lower-high resistance inside of the March high at 107.29.
USD/JPY Four-Hour Chart: Lower-High Resistance Potential After Last Week’s Bearish Break
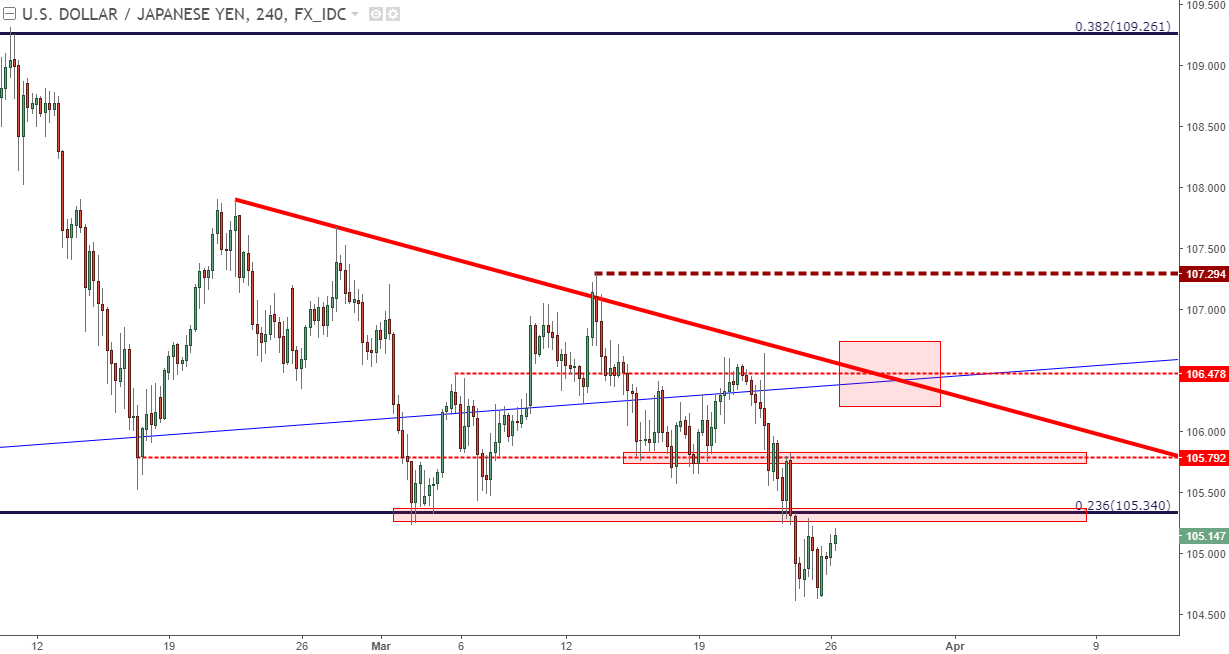
Chart prepared by James Stanley
NZD/USD Testing Longer-Term Resistance
One pair that may remain as interesting on the long side of the US Dollar is NZD/USD. NZD/USD began a test of a long-term area of resistance in the first couple of weeks of this year and, to date, prices remain very near this zone. Last week produced a quick lower low, but that was soundly reversed as USD-weakness came back into the fray. But, for top-side USD scenarios, the longer-term resistance that continues to show in NZD/USD is likely one of the more compelling markets at the moment.
NZD/USD Weekly Chart: Range-Bound Since 2016, Prices Remain Near Long-Term Resistance

Chart prepared by James Stanley
To read more:
Are you looking for longer-term analysis on the U.S. Dollar? Our DailyFX Forecasts for Q1 have a section for each major currency, and we also offer a plethora of resources on USD-pairs such as EUR/USD, GBP/USD, USD/JPY, AUD/USD. Traders can also stay up with near-term positioning via our IG Client Sentiment Indicator.
Forex Trading Resources
DailyFX offers a plethora of tools, indicators and resources to help traders. For those looking for trading ideas, our IG Client Sentiment shows the positioning of retail traders with actual live trades and positions. Our trading guides bring our DailyFX Quarterly Forecasts and our Top Trading Opportunities; and our real-time news feed has intra-day interactions from the DailyFX team. And if you’re looking for real-time analysis, our DailyFX Webinars offer numerous sessions each week in which you can see how and why we’re looking at what we’re looking at.
If you’re looking for educational information, our New to FX guide is there to help new(er) traders while our Traits of Successful Traders research is built to help sharpen the skill set by focusing on risk and trade management.
--- Written by James Stanley, Strategist for DailyFX.com
To receive James Stanley’s analysis directly via email, please SIGN UP HERE
Contact and follow James on Twitter: @JStanleyFX


