


Talking Points:
- This week’s economic calendar has a heavy USD and GBP focus, with rate decisions out of each representative Central Bank to go along with a release of UK inflation numbers from the month of February. Ahead of those items, GBP/USD is putting in a bullish breakout on news of an agreement between the EU and UK on a Brexit transition deal.
- Wednesday brings new Fed Chair Jerome Powell’s first rate decision atop the bank, and markets are currently holding a 94.4% chance of a hike at that meeting. The bigger question is the rest of the year, as current probabilities are pointing to a 33.9% chance of four hikes (100 bps) from the Fed this year, and a 74.2% chance of three hikes (75 bps).
- Are you looking to improve your trading approach? Check out Traits of Successful Traders. And if you’re looking for an introductory primer to the Forex market, check out our New to FX Guide.
If you’re looking for short-term indicators on GBP/USD, check out our IG Client Sentiment Indicator.
British Pound Poses Bullish Breakout At Start of Big Week
This should be an important week for the British Pound. Tomorrow morning brings inflation numbers for the month of February and then on Thursday we get the Bank of England for a rate decision. With this being a non-Super Thursday rate announcement, expectations are very low for any actual moves. More pressing will be the bank’s tolerance for a rate hikes later in the year after the hawkish twist that was seen in February. The driver for that hawkish shift at the Bank of England has been inflation, and this continues above the 3% figure that’s more than 50% away from the BoE’s own target of 2%; and it’s been that way for five consecutive months now.
UK Inflation Remains Elevated Above the BoE’s Target; February Inflation Due on Tuesday

Chart prepared by James Stanley
The British Pound is catching a bid ahead of tomorrow’s inflation release, with GBP/USD being driven by some optimistic news on the Brexit-front. News of an agreement on a Brexit transition deal have helped to prod-prices higher in GBP/USD. Prices had previously posed a bullish breakout from a bearish trend-line last week, helping to further build-in to a shorter-term bullish channel in the process. Price action caught a bit of support on the projection of that bearish trend-line on Friday, and have since rallied above channel resistance.
GBP/USD Four-Hour Chart: From One Trend-Line to Another, Bullish Channel Building

Chart prepared by James Stanley
This helps to put the longer-term trend back in-focus in GBP/USD, which was on a steady climb-higher through most of 2017 and the first month of 2018. That bullish trend began to pull back in late-January, and that retracement has lasted pretty much ever since, allowing for the bearish trend-line looked at above to form. But, after last week’s bullish breakout, and with this shorter-term bullish channel forming ahead of a couple of key UK drivers, might we be on the cusp of longer-term trend resumption?
GBP/USD Daily Chart: Is the Longer-Term Bullish Trend Ready for Resumption?

Chart prepared by James Stanley
FOMC Is On Wednesday
On Wednesday at 2 PM ET, we’ll get the first rate decision and press conference from new Fed Chair, Jerome Powell. This meeting is carrying a very high probability for a hike, with odds currently pegged at 94.4% via CME Fedwatch. This comes along with an approximate 33.9% chance of four full hikes from the Fed this year, and a 74.2% chance of getting three hikes.
To say that all eyes will be on Mr. Powell might be an understatement, as we’ve seen pressure starting to show in a variety of asset classes out of the US, including both stocks and bonds. This comes on the heels of some interesting volatility that showed around Mr. Powell’s first public appearance in late-February/early-March around the semiannual Humphrey Hawkins testimony. US Stocks have had a rough couple of weeks which hail in comparison to the sell-offs of early-February but, nonetheless, bear mention as we approach this rate decision. The S&P 500 is currently in the process of testing an interesting area of support, taken from a bullish trend-line projection connecting those February lows; and this runs into an area of prior swing support/resistance around 2726.
If you’re looking for short-term indicators on SPX500, check out our IG Client Sentiment Indicator.
S&P 500 Four-Hour Chart: Testing Trend-Line Support Ahead of the Fed

Chart prepared by James Stanley
US Dollar Continues to Test 90.00 After Last Week’s Support Settle
On Wednesday of last week we looked at DXY running down to support after a disappointing release of US retail sales. That support scuttled the pressure, and by the end of the week we were back-above the 90.00 level on DXY. But, as we’ve seen on numerous occasions over the past year, buyers lost motivation as we tested resistance and prices are falling again as we open a new week. The longer-term expanding range remains in order, but direction is lacking from near-term price action as prices meander across the 90.00 level.
US Dollar via 'DXY' Four-Hour Chart: Meandering Around 90.00
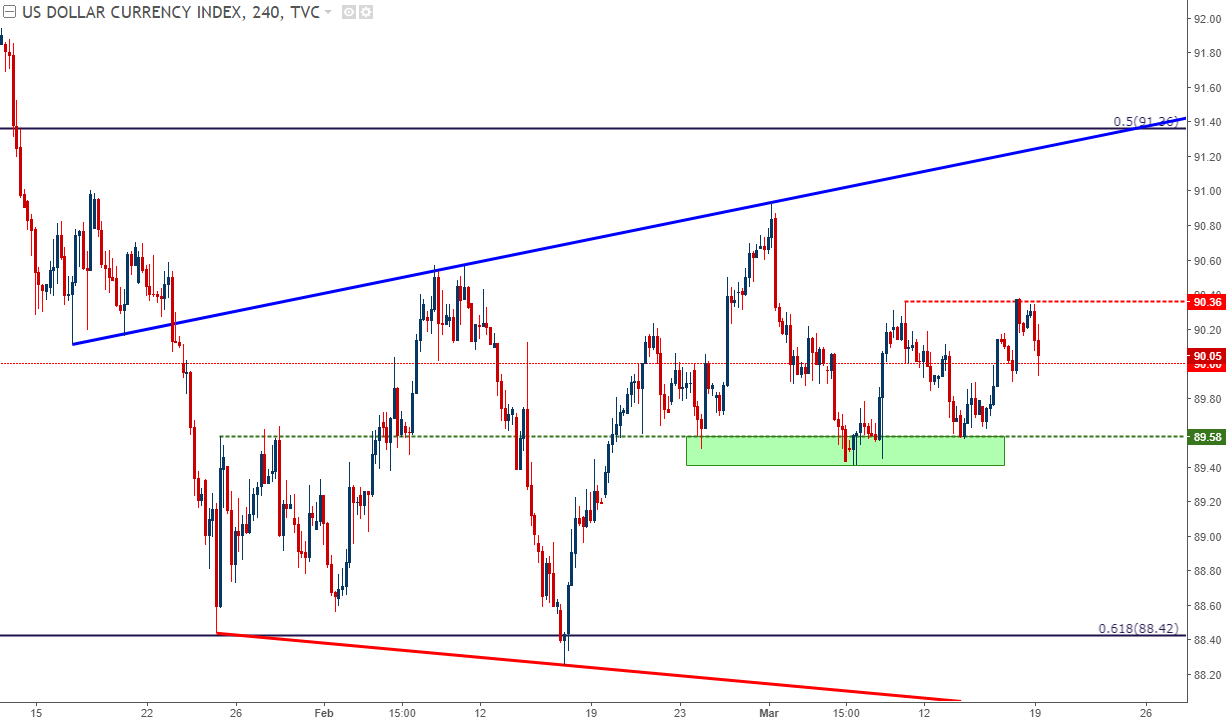
Chart prepared by James Stanley
EUR/USD Near-Term Tests Well-Worn Support; Longer-Term Up-Trend Remains
EUR/USD remains in a range that’s been present over the past seven weeks. This range hasn’t developed due to a lack of effort from bulls, as we stretched up to a fresh three year-high a month ago, but buyers weren’t able to offset the influx of sellers above 1.2500 and prices have seen settled in with a fairly consistent set of support levels. The longer-term bullish trend remains in-tact, and we’re getting nearer to an area of confluence from pre-existing support structure’s intersection with the bullish trend-line that connects last year’s lows in the pair.
If you’re looking for short-term indicators on EUR/USD, check out our IG Client Sentiment Indicator.
EUR/USD Daily Chart: Nearing Confluent Support Structure with 2017 Bullish Trend-Line

Chart prepared by James Stanley
USD/JPY Continues to Ride Long-Term Support
In the realms of major FX pairs, few are as interesting in terms of longer-term context as what’s going on in USD/JPY. This appears to be a tug-of-war around the QE/QT front, as rising rates of Japanese inflation have helped to drive-in Yen-strength in 2018. This comes as the Bank of Japan continues to say that they’re not yet ready to start looking at stimulus taper or pulling back on QE, but this is similar to what happened around the Euro and the ECB last year: That didn’t stop traders from buying the Euro in anticipation of some type of shift, even if it took almost a year for the initial signs of such a move starting to show.
USD/JPY has now spent the past six weeks testing the support side of this multi-year symmetrical wedge pattern; and this support in the pair is the first element of Yen-resistance that had shown so far in 2018.
USD/JPY Weekly Chart Continues Test of Wedge Support
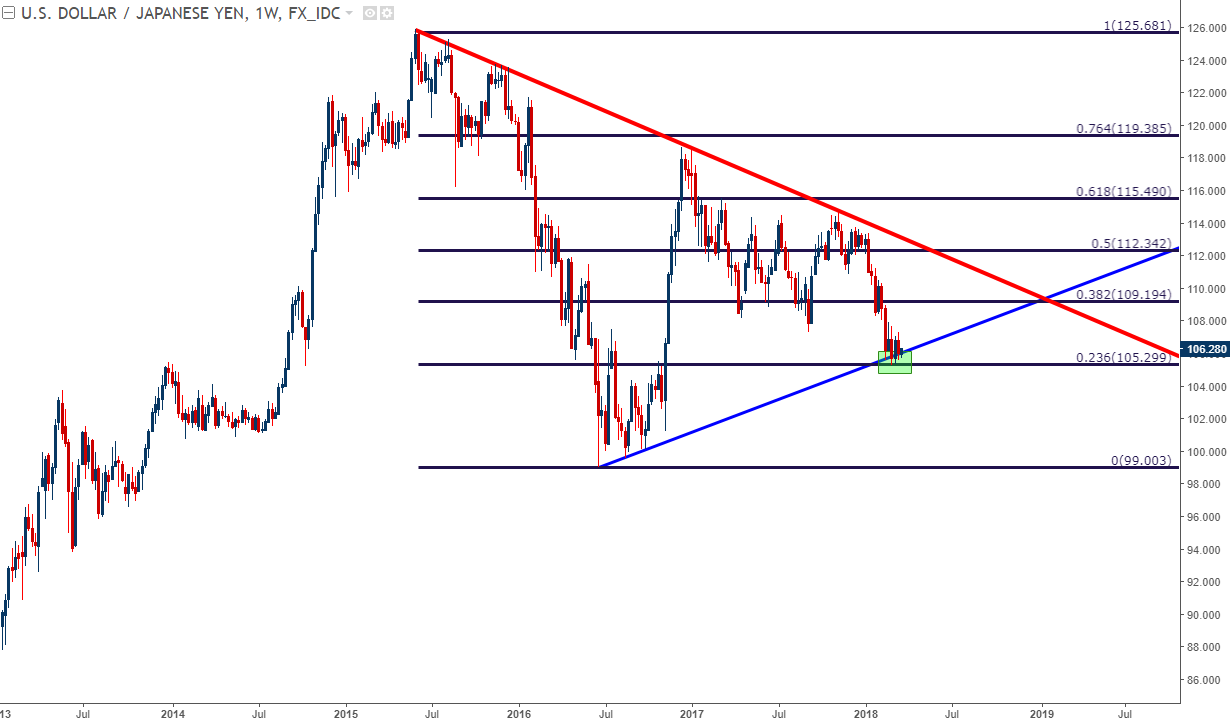
Chart prepared by James Stanley
On a shorter-term basis, this wedge has started to see tests intra-day throughout the month of March, and this comes a full two weeks after the first touch of that trend-line in mid-February. A bit of secondary support has shown at 105.30, which is the 23.6% Fibonacci retracement of the 2015-2016 major move in the pair, helping to mark the current 15-month low in the pair.
Notable, however, is the series of lower-highs that have started to show since that longer-term support has started to come into play; begging the question, might a bigger-picture break be in store around the Japanese Yen?
If you’re looking for short-term indicators on USD/JPY, check out our IG Client Sentiment Indicator.
USD/JPY Four-Hour Chart: Lower-Highs as Longer-Term Support Has Come Into Play
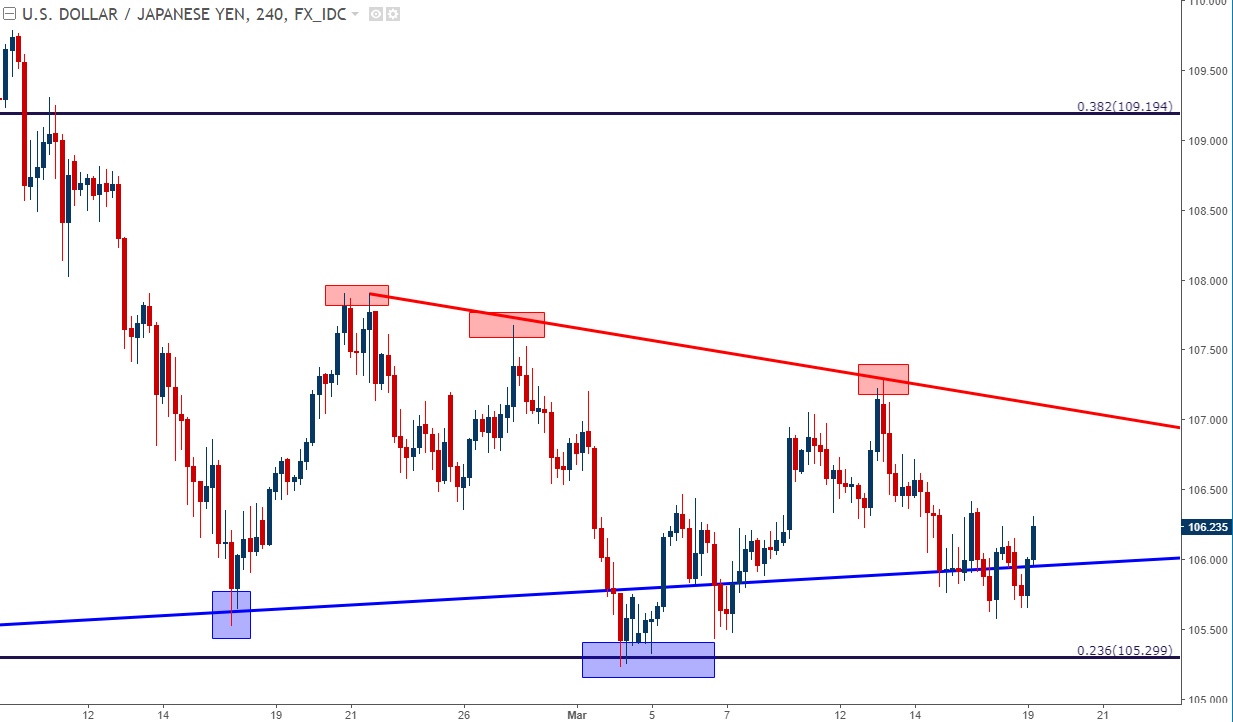
Chart prepared by James Stanley
To read more:
Are you looking for longer-term analysis on the Euro, the British Pound or the U.S. Dollar? Our DailyFX Forecasts for Q1 have a section for each major currency, and we also offer a plethora of resources on our EUR/USD, GBP/USD, USD/JPY, AUD/USD and U.S. Dollar pages. Traders can also stay up with near-term positioning via our IG Client Sentiment Indicator.
--- Written by James Stanley, Strategist for DailyFX.com
To receive James Stanley’s analysis directly via email, please SIGN UP HERE
Contact and follow James on Twitter: @JStanleyFX


