


Talking Points:
- USD weakness continues to drive through most major FX-pairs after last week’s Thursday-turnaround. This continues the Greenback’s year-plus slump that’s seen as much as 15% of its value erased. EUR/USD is continuing the bounce from Fibonacci support last week, and USD/JPY is testing a deeper support level ahead of a key Bank of Japan interest rate decision.
- US equities have seen bids return after last week’s sell-off, with support cauterizing around the 38.2% Fibonacci retracement of the February sell-off. Price action is now making a fast approach towards a prior area of resistance around 2750, which had shown a brief amount of support before last week’s bearish move.
- Are you looking to improve your trading approach? Check out Traits of Successful Traders. And if you’re looking for an introductory primer to the Forex market, check out our New to FX Guide.
If you’re looking for longer-term analysis on US Stocks, the Euro or the U.S. Dollar, click here for our Trading Guides.
Prevailing Themes of USD Weakness, Equity Strength Come Back
In what’s becoming a more regular occurrence, USD bears have come back while US equities have rallied. Last week produced a spate of strength in the US Dollar that saw DXY make a fast approach towards the 91.00 level; and this also brought pressure into US equities as stocks fell each day Tuesday-Thursday. But Thursday afternoon is around the time that ‘tariff talk’ came into the equation, and since then we’ve seen bears come back into the US Dollar while stocks have cauterized some support and moved back towards prior resistance. On the chart below, we’re looking at the S&P 500 after last week saw support settle around the 2662 level, which is the 38.2% retracement of the February sell-off in the index and this came into play during last Thursday’s webinar. The next level of resistance resides around 2750, as this was a prior group of swing-highs produced two weeks ago which set around the 61.8% retracement of the same Fibonacci study.
S&P 500 Four-Hour Chart: Fibonacci Support Leads to Bounce From Last Week’s Lows
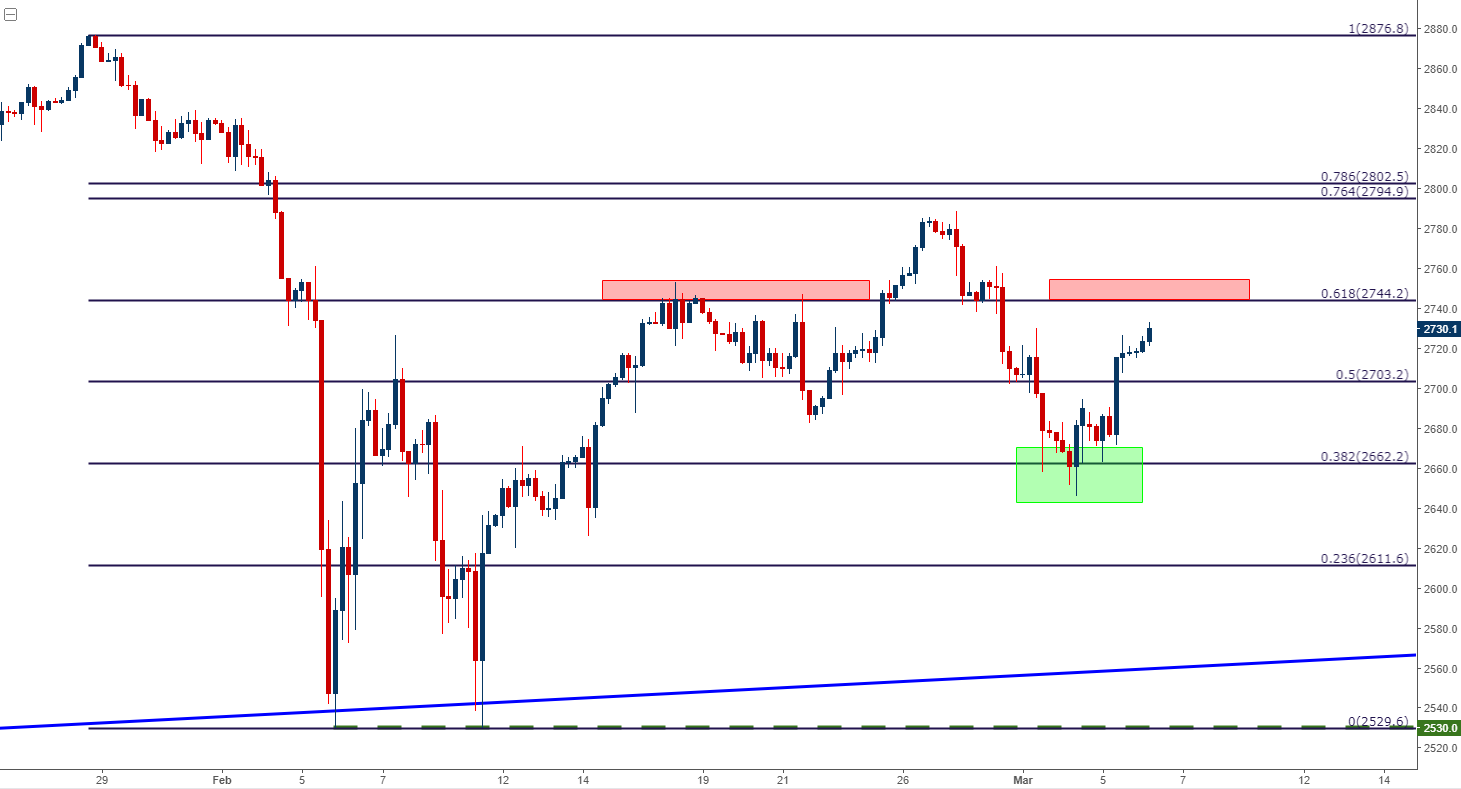
Chart prepared by James Stanley
Dollar Falls, DXY Crosses Back-Below 90.00 Level
In the US Dollar, last week’s strength on the back of Day One of Mr. Powell’s testimony drove DXY back-above the 90.00 level. The Thursday-turnaround on the basis of taper talk saw the move pull back, and support held throughout yesterday as a short-term range had developed. But, even that could not hold as bears came back to push prices right back towards prior support around 89.50. This continues the Greenback’s rough and tumble 2018 after what was an aggressively bearish 2017.
US Dollar via ‘DXY’ Daily Chart: Back-Below 90.00, Sellers Remain in Control
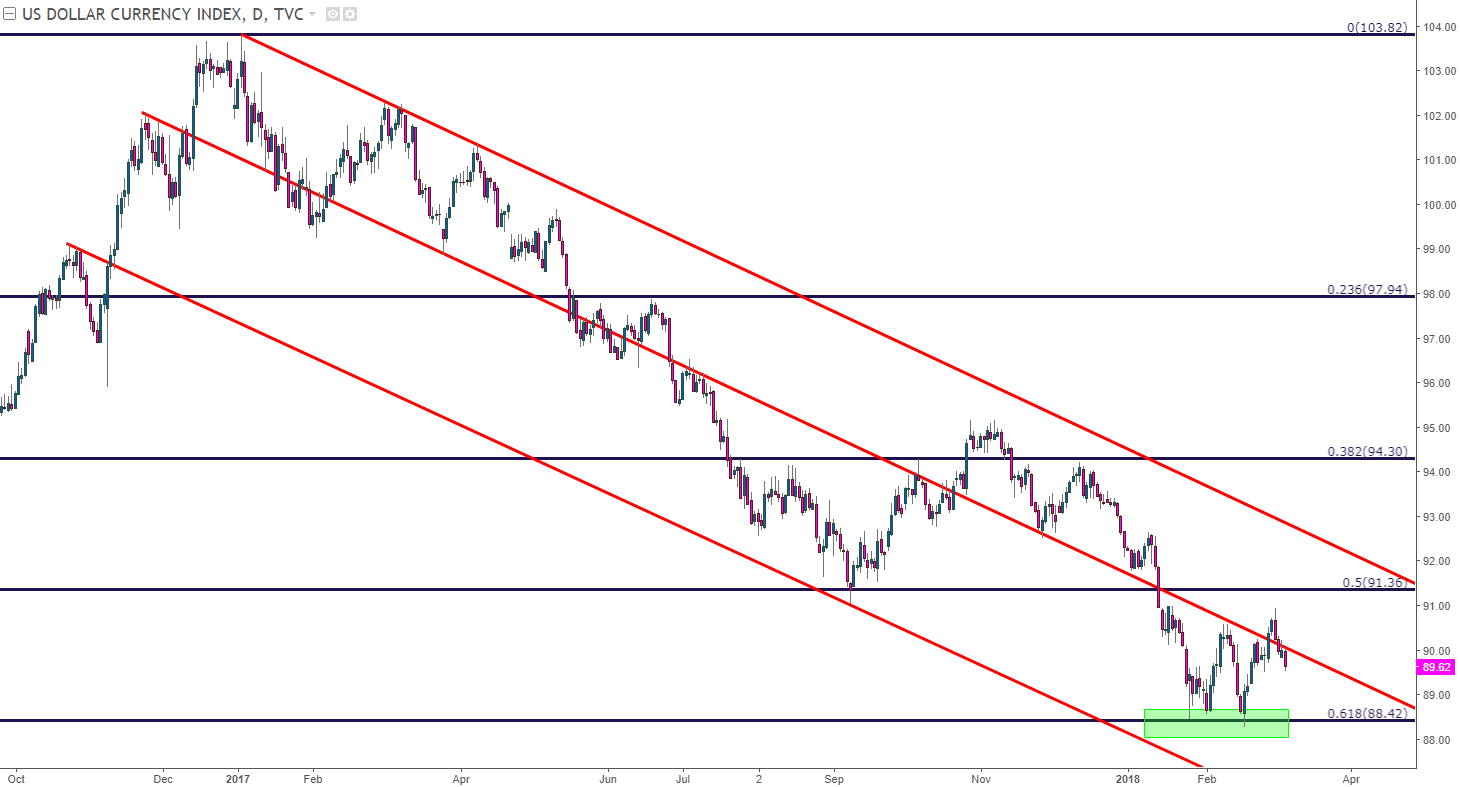
Chart prepared by James Stanley
A Hot Coal or a US Treasury Bond?
The big question here is one of drivers, as such an extended move of weakness in a major currency, one that is being supported with a string of rate hikes no-less, will rarely put in such an extended drop. This is likely related to the continued rise in US Treasury Yields, which goes back to the Fed’s Quantitative Tightening along with a host of additional Treasury auctions in the next few years. The US Government is expanding to the tune of $500 Billion in extra spending over the next two years to go along with a Trillion worth of tax cuts over the next 10 years. Given that the US government runs at a deficit, this extra spending will need to be funded by debt. This means more supply of US government paper, which means lower prices and higher yields. This, when combined with the fact that the Fed is no longer actively accumulating Treasuries as part of QE and are actually going in the other direction by letting debt ‘roll off’ the balance sheet means that there’s also less demand.
So, more supply and less demand; which means that prices should continue to correspondingly move-lower until some form of equilibrium is found. This is likely a major contributing factor to USD weakness even as the Fed is one of the few major Central Banks actively looking to raise rates. There are Central Banks still actively buying bonds as part of QE in Europe and Japan, so if a hedge fund wants to buy bonds in the current backdrop, those issues could be considerably more attractive given that demand is still being supported by the representative Central Bank.
This speaks to the comment from legendary trader and hedge fund manager, Paul Tudor Jones, who has recently said that if given the option of holding a US Treasury bond in one hand or a hot coal in the other, he’s choosing the hot coal.
10-Year US Treasury Yields (Monthly Chart) Continue Move Towards Seven-Year Highs of 3.04%
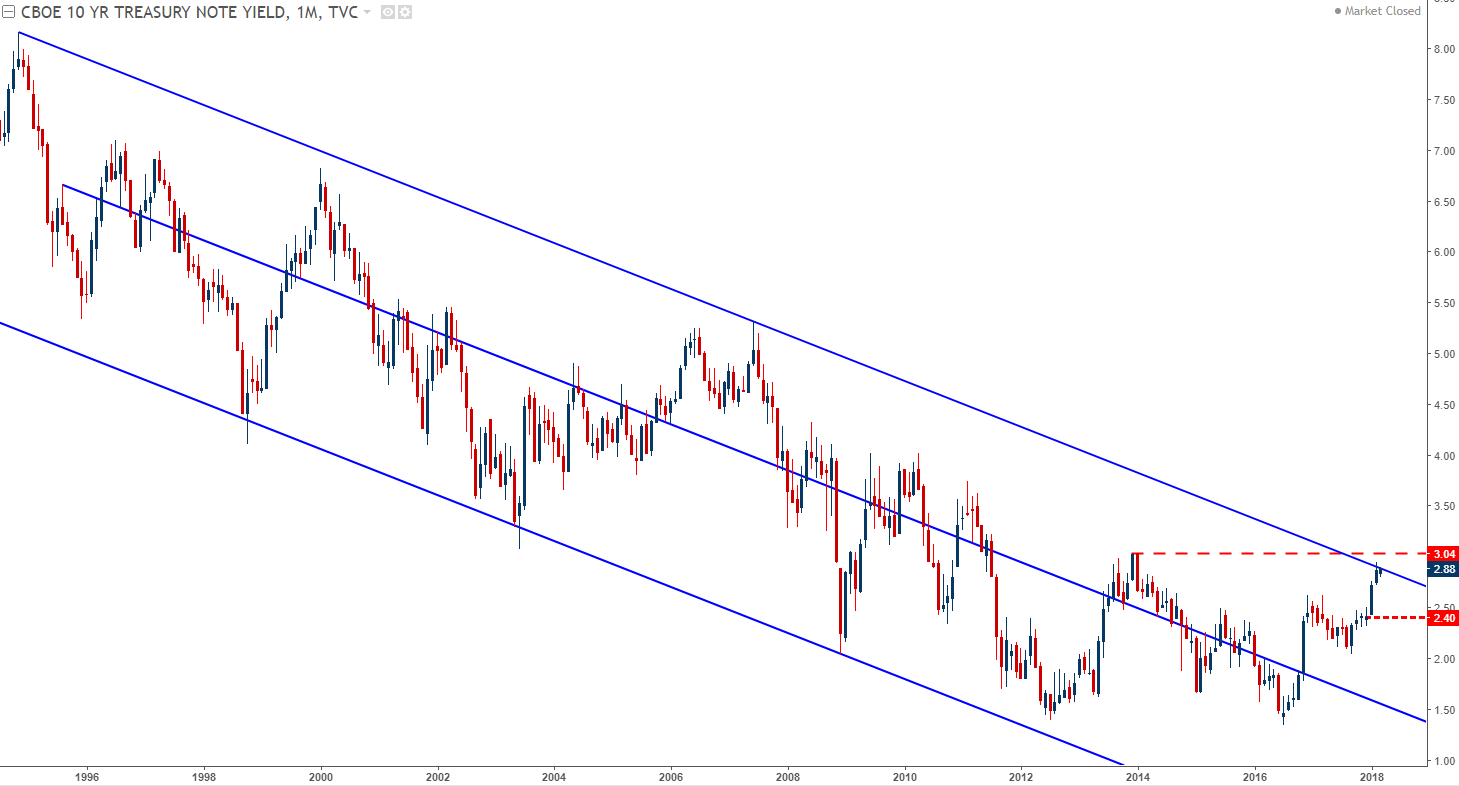
Chart prepared by James Stanley
Diminished demand for US Treasuries combined with increased demand for European or Japanese debt helps to explain the persistent weakness that’s continued to show in the Greenback; and this is a theme that can continue until that supply/demand equilibrium is found in US Treasuries. On the hourly chart below, we can see that weakness bursting back into the US Dollar after the Thursday-turnaround.
US Dollar via ‘DXY’ Hourly Chart: Thursday-Turnaround Sees USD Bears Regain Control

Chart prepared by James Stanley
Central Banks Populate This Week’s Calendar
There are few USD-drivers of significance on this week’s calendar until we get to Friday’s Non-Farm Payrolls release. What we do have ahead of that print is a basket of Central Bank rate decisions that could keep price action on the move; with two really big rate decisions on Thursday with the European Central Bank followed by the Bank of Japan.
DailyFX Economic Calendar: Busy Remainder of the Week with BoC, ECB, BoJ and NFP

Chart prepared by James Stanley
Yen as Euro 2.0
Both banks appear to be facing similar dilemmas albeit with different timing, with market participants appearing to position in the event of a taper or announcement of stimulus exit. While neither Central Bank has actively signaled that such is on the horizon, it’s become almost assumed that something will be in the cards before too long as growth and inflation both continue to show with a bit of stability in each economy.
In Europe, this was the drive in 2017 as the single currency continued to gain even as the ECB denied that stimulus taper was on the horizon. As we’ve turned the corner into 2018, the initial phases of a shift have started to present themselves but, to date, nothing has been confirmed by the ECB.
EUR/USD Four-Hour Chart: Fibonacci Bounce Extends Towards 1.2500 Resistance
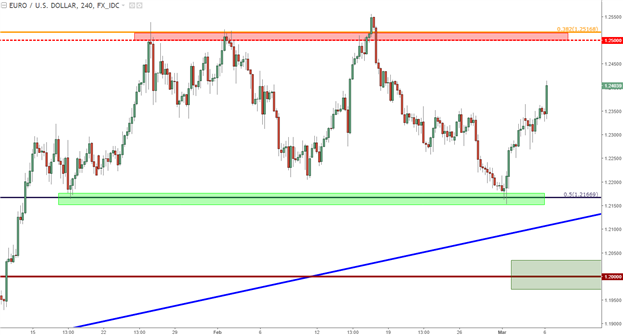
Chart prepared by James Stanley
Yen Strength Persistent as Japanese Inflation Continues to Rise
In Japan, this theme is less-developed but similar nonetheless; as inflation has started to really get attention over the past two months. In January, December inflation came-out at 33-month highs of one-percent; and last month January numbers were released to the tune of 1.4%. This is getting very close to the BoJ’s goal of 2% inflation, thereby making for a difficult argument to justify even more stimulus as had come into the conversation in the second half of last year.
Thursday’s BoJ rate decision will be the first since January inflation numbers printed, and it’s going to be interesting to see what the BoJ has to say about their stimulus program with inflation continuing to show gains.
Japanese Inflation at 34-Month Highs in January, 2018
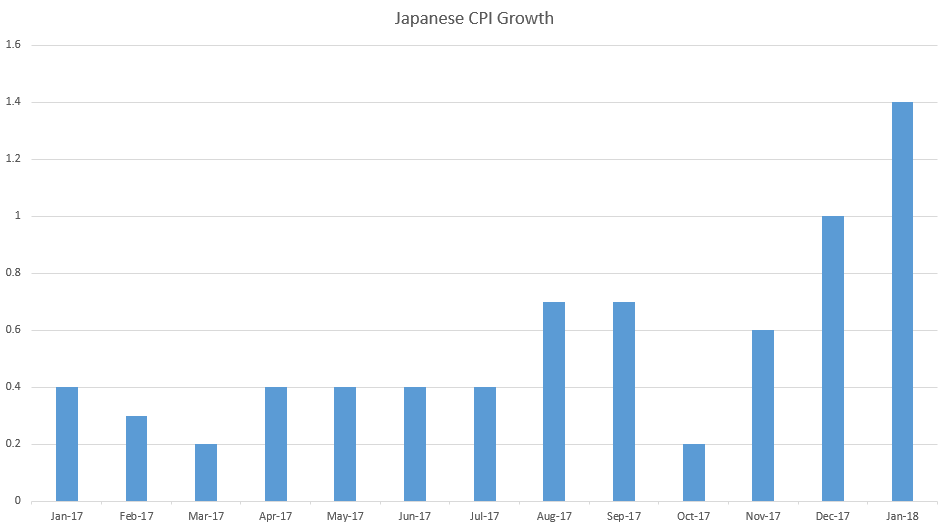
Chart prepared by James Stanley
In USD/JPY, the pair continues to hold around the support side of a symmetrical wedge pattern that’s been building for a couple of years now. Yen strength has been a fairly consistent theme thus far in 2018 as these stronger rates of inflation have been availed.
USD/JPY Weekly Chart

Chart prepared by James Stanley
The support side of that wedge began to get tested in mid-February, and saw a deeper test last Thursday/Friday. A bit of deeper support appears to be showing off of the 23.6% retracement of the 2015-2016 major move. On the hourly chart below, we’re looking at a series of potential resistance levels that can be interesting for short-side continuation strategies in USD/JPY.
USD/JPY Hourly Chart: Lower-High Resistance Potential
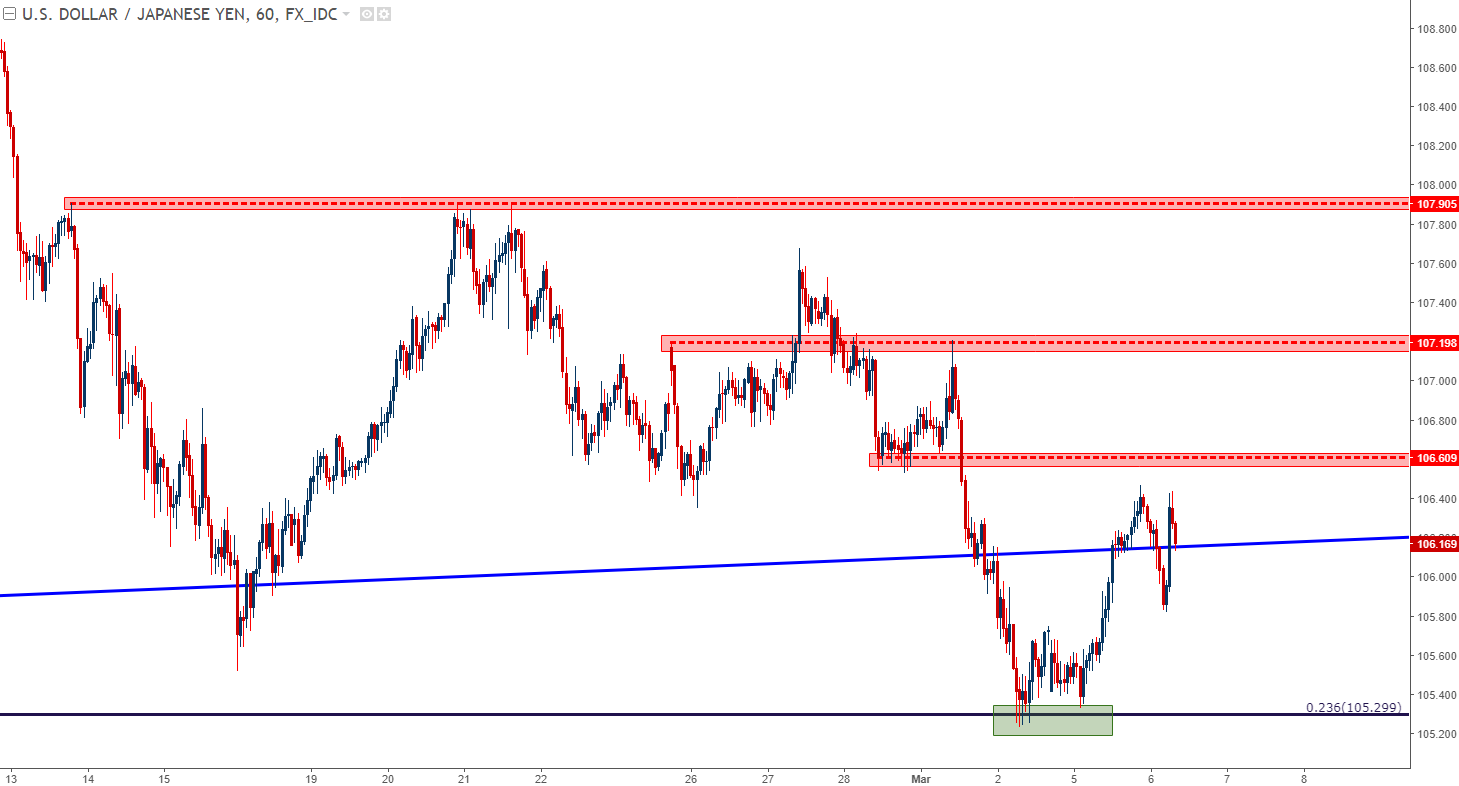
Chart prepared by James Stanley
To read more:
Are you looking for longer-term analysis on the Euro, the British Pound or the U.S. Dollar? Our DailyFX Forecasts for Q1 have a section for each major currency, and we also offer a plethora of resources on our EUR/USD, GBP/USD, USD/JPY, AUD/USD and U.S. Dollar pages. Traders can also stay up with near-term positioning via our IG Client Sentiment Indicator.
--- Written by James Stanley, Strategist for DailyFX.com
To receive James Stanley’s analysis directly via email, please SIGN UP HERE
Contact and follow James on Twitter: @JStanleyFX


