


Talking Points:
- Today brings the second day of Mr. Jerome Powell’s Humphrey Hawkins testimony. Today, the Semiannual Monetary Report to Congress takes place in-front of the Senate Banking Committee, beginning at 10 AM ET.
- The Dollar has remained bid since Tuesday’s appearance from Mr. Powell, and USD is fast approaching the 91.00 level in DXY. This has crafted deeper retracements in both EUR/USD and GBP/USD; but the more interesting Dollar-pair may be the one where not much is actually happening, and that’s USD/JPY. The Yen continues to exhibit considerable strength, giving further confirmation of the ‘Yen as the Euro 2.0’ after last year’s bullish run in the single currency. This is further explained below with emphasis on both EUR/JPY and GBP/JPY, each of which have put-in significant bearish movement over the past 24 hours.
- Are you looking to improve your trading approach? Check out Traits of Successful Traders. And if you’re looking for an introductory primer to the Forex market, check out our New to FX Guide.
If you’re looking for longer-term analysis on US Stocks, the Euro or the U.S. Dollar, click here for our Trading Guides.
USD Strength Continues as Dollar Remains Bid
The US Dollar continues to catch bids and this strength is showing against most major currencies. The one notable exception, however, is the Japanese Yen as prices there remain in a relatively range-bound format. This can be somewhat vexxing for some market participants, particularly given the general penchant for correlations and proxy markets. USD/JPY is often looked at as a barometer of risk tolerance, with Yen strength taking over bids in the Dollar as investors brace for volatility ahead.
US Dollar via ‘DXY’ Four-Hour Chart: Closing the Month at Highs
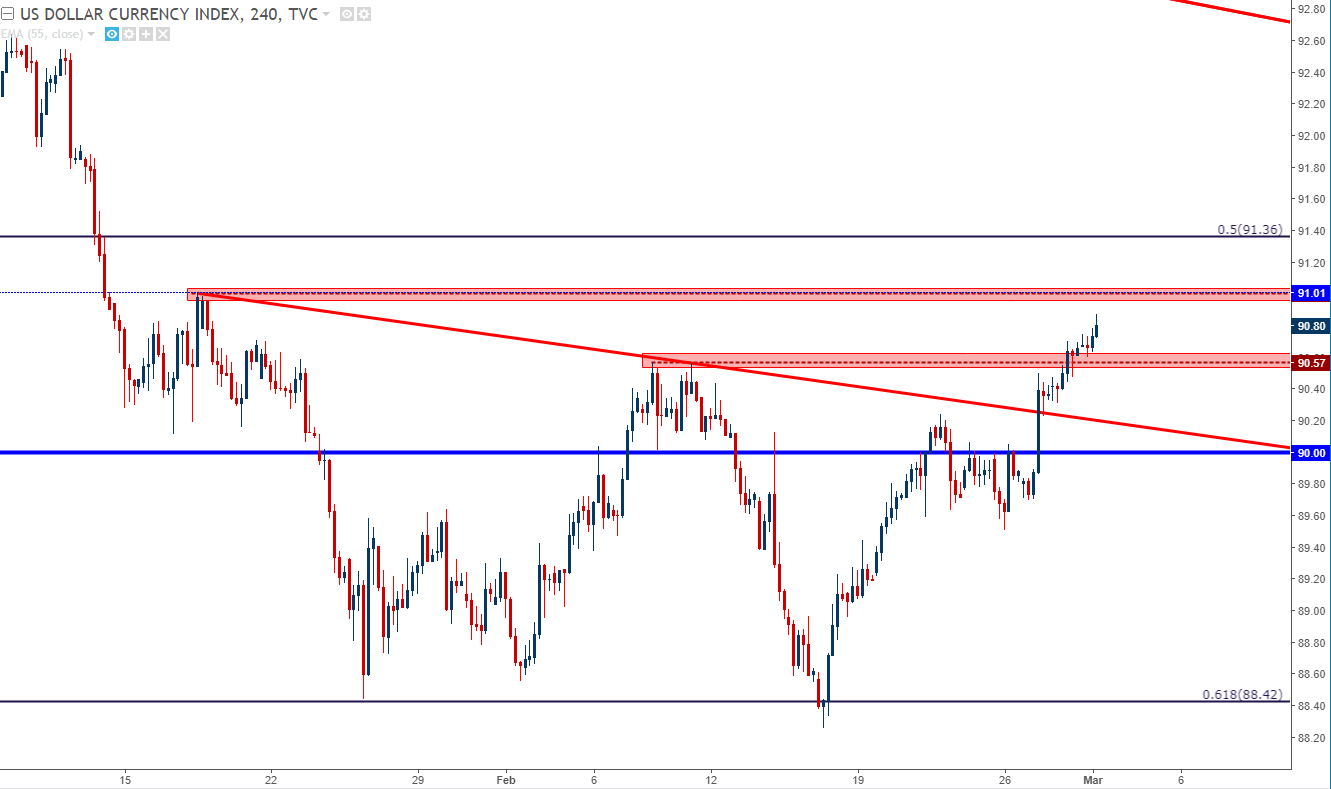
Chart prepared by James Stanley
Yen Strength Offsetting Dollar Bids
And while that Yen strength was showing quite viscerally against the US Dollar in the first half of February, the past couple of weeks have seen prices see-saw back-and-forth. But – if we look elsewhere, using previously strong currencies on either side of USD or JPY; we can see considerable strength in both American and Japanese currencies.
But there may be another reason that USD/JPY hasn’t yet shown those risk-aversion tendencies, and this is something we started to look at a few weeks ago. The precipitous drop in the first seven weeks of the year pushed prices in USD/JPY down to a key trend-line projection. This trend-line projection makes up the support side of a multi-year symmetrical wedge pattern. Since this support came into play two weeks ago, bears have been unable to make much ground.
USD/JPY Weekly Chart: Symmetrical Wedge Continues to Hold the Lows
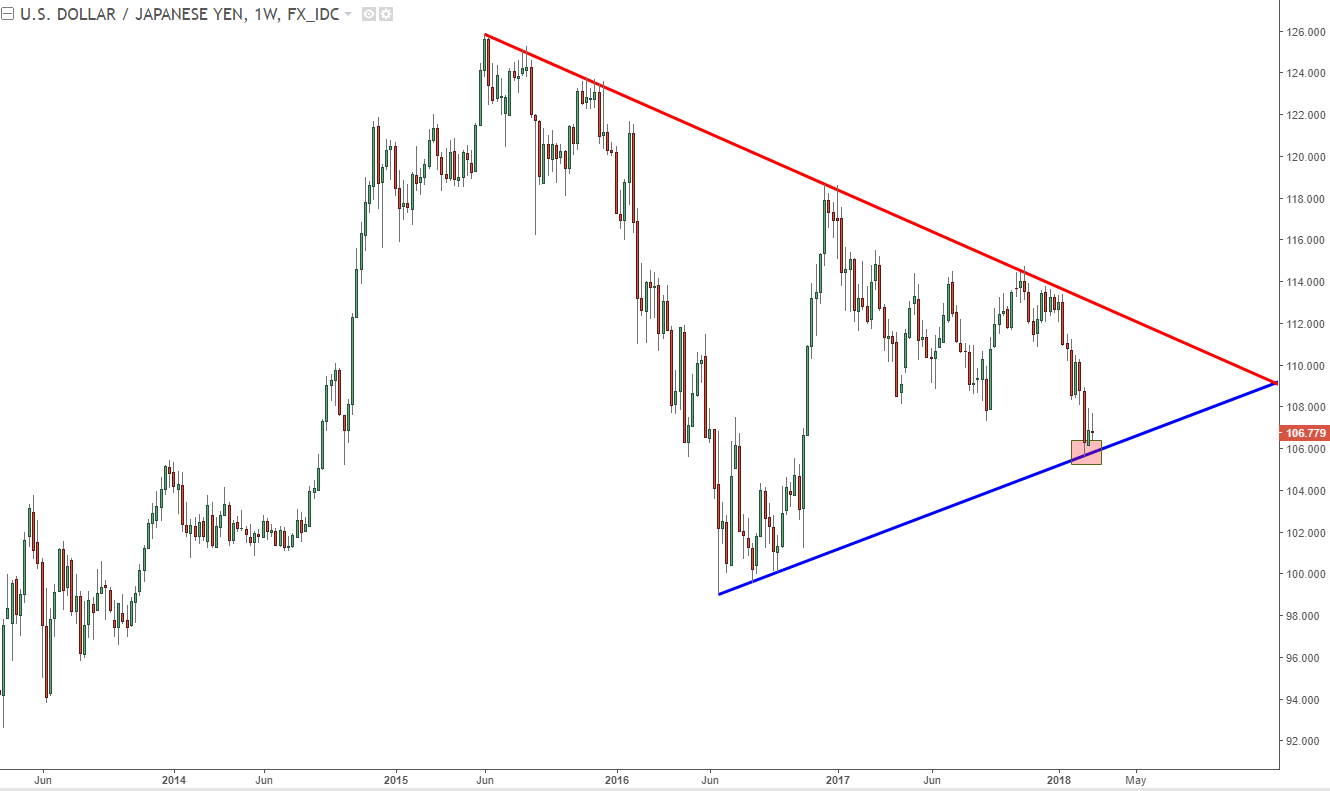
Chart prepared by James Stanley
Yen Strength as a Prevailing Theme
If we walk away from the US Dollar and look elsewhere at pairs such as EUR/JPY and GBP/JPY, that Yen strength is fairly clear. The big question is why such a change of pace?
Yen-weakness was a favored theme because the BoJ was one of the most dovish Central Banks around-the-world. The massive QE program that the BoJ began in 2012 continued to drive liquidity into Japanese markets (and even some international ones via their purchase of ETF’s). This continued addition of liquidity kept the Yen weak; and the fact that inflation remained rather subdued kept calls for tapering or stimulus-exit at bay.
But that inflation argument has been undergoing some significant change of late: In December, Japanese inflation came-in at a 33-month high of 1%; and in January that inflation jumped all the way up to 1.4%. As these inflation reads have continued to grow, expectations for the Bank of Japan to slow down stimulus or, at the very least, begin looking at options to taper have continued to grow louder. To date, we have no such indication from the BoJ: But seemingly positive factors continue to get brushed off as market participants focus more-intently on the continued rise in prices.
Japanese Inflation Continues to Rise: An Unfriendly Trend for the BoJ
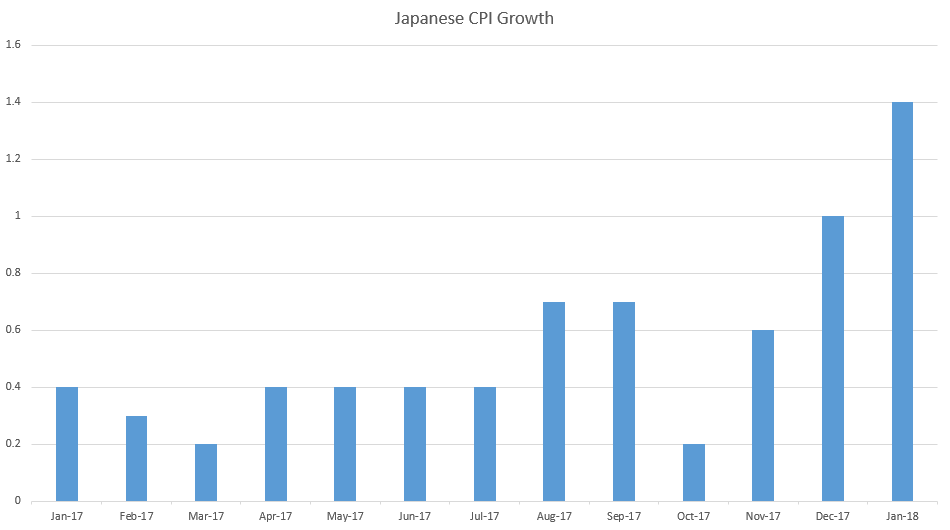
Chart prepared by James Stanley
Yen as Euro 2.0?
If this scenario sounds familiar, it is. This is similar to what happened with the Euro last year. Coming into 2017, many banks were looking for a re-test of parity in EUR/USD. That, of course, did not happen; but what did take place was a quick rush of strength in April that never really reversed. This was driven by stronger growth and inflation in Europe leading many market participants to try to get in-front of any potential stimulus exit or taper that may take place.
Markets are not entirely reactive. Market participants aren’t going to wait around for something to be confirmed before beginning to price that theme in. So despite all the cries, qualms and quips about EUR/USD price action being so divorced from yields or US-Europe bond spreads, the price is always right: In both markets. In both markets are traders making bets, and we won’t know who is right until it’s time to tally up wins versus devastation. This is something that can only be taught by having actual skin in the game.
When the ECB punted on stimulus exit in October, the Euro finally started to pull back. But that pullback was weak, and lasted for less than half-a-month before bulls returned after German GDP came-in red-hot.
That strength in the Euro has largely continued. Until now, that is. Now investors appear to be focusing more-intently on the prospect of a similar scenario happening out of Japan – where strong growth and inflation numbers lead to a chorus of calls for the BoJ to, at the very least, begin plotting for how they might look to unwind or even slow down the trillions in accommodation that have been added to the balance sheet under Shinzo Abe and recently re-appointed BoJ, Governor, Haruhiko Kuroda.
This can keep the Yen bid, at least until we hear from the BoJ. The big question is what the bank might be able to say that could pacify risk markets; and whether or not they can actually get back-in the driver’s seat behind JPY. Until then, Yen strength appears to be a workable theme in the near-term. The next BoJ rate decision is March 8-9, so we’re about a week away from some additional clarity on the matter.
EUR/JPY Breaches Support Zone
EUR/JPY has just run down to fresh five-month lows and is currently testing the 130.00 psychological level. Underneath, we have a potential support level around 129.66, as this is the 50% retracement of the 2014-2016 down-trend. The 61.8% retracement of this same move gave multiple iterations of resistance last year, thereby giving this Fibonacci study a degree of validation.
EUR/JPY Daily: A Brutal Change of Pace, Support Break Opens the Floodgates

Chart prepared by James Stanley
The way to use this here would be to look for some support to develop in order for prices to firm-up, at which point the pair can be sold again. Potential lower-high resistance at either of the three levels below could be interesting for such a theme.
EUR/JPY Hourly: Support Showing Around 130.00, Look for Lower-High Resistance
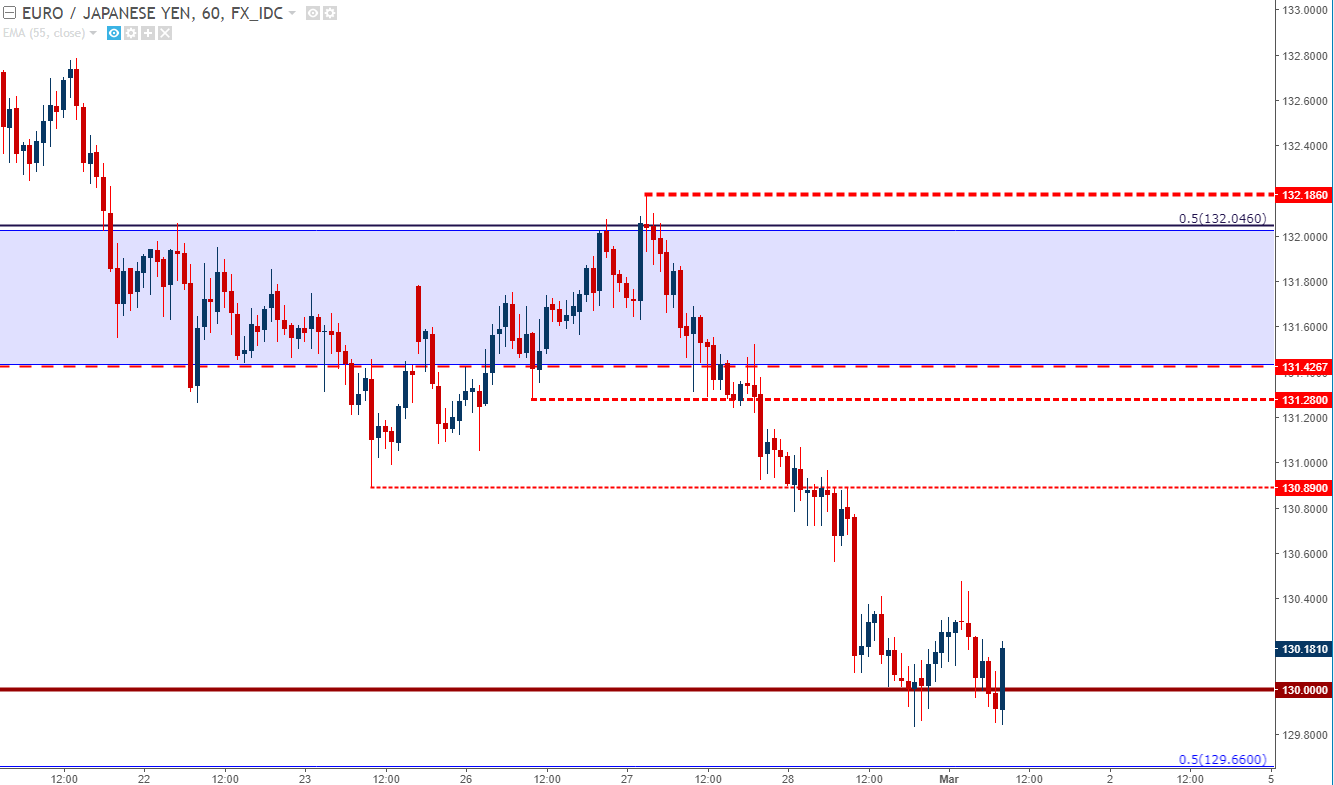
Chart prepared by James Stanley
GBP/JPY Breaks the Post-Brexit Trend-Line
GBP/JPY put in a rather large move yesterday; but the more notable event was how the move came-in. GBP/JPY found support off of the post-Brexit trend-line a couple of weeks ago; and after multiple tests of support the pair was finally able to drive through yesterday. But – as we warned, a breach of that trend-line could open the door to significantly more bearish movement, and that’s precisely what happened as prices shredded-through multiple support levels on the way down to a key area on the chart.
The price of 147.04 was a big level in 2017. This had helped a triple top form in the pair in the first half of the year and then a double bottom in Q4. Yesterday’s price action saw prices rush down for a test of this level; and after it held for a few hours, sellers continued to push on through to help create a fresh five month low in the pair.
Be really careful here: Near-term GBP/JPY is quite oversold, and if this thing retraces it can rip-higher for a while.
GBP/JPY Daily Chart: Trend-Line Break into a Key Fibonacci Level

Chart prepared by James Stanley
For shorter-term stances, we saw a bit of resistance develop around that 147.04 level. This led to another rush of selling, but that was met with a higher-low; which isn’t exactly encouraging for bearish continuation approaches. On the below chart, we’re looking at three levels of resistance above 147.04.
EUR/USD Testing Fibonacci Support
As we discussed yesterday on EUR/USD, support was slipping as USD-strength continued, and we were likely looking at more down-side until a deeper level of support came-into play.
EUR/USD Four-Hour Chart: March Open Testing Swing-Low from Mid-January

Chart prepared by James Stanley
The first of those deeper levels that we looked at was 1.2167, which is the 50% Fibonacci retracement of the ECB QE move, taking the 2014 top down to the 2017 low. This same level had helped to set support in mid-January, and so far on the morning, we’re seeing this act as a barrier to deeper losses. If this cannot hold, the next major area of support shows around the 1.2000 psychological level. This was a big level to EUR/USD price action last year, helping to offer resistance on numerous occasions. But, after the early-year burst-higher in the Euro, 1.2000 has not yet offered much for support. A higher low on a longer-term basis here could make the prospect of bullish continuation attractive again.
EUR/USD Daily Chart: Longer-Term Bullish Trend Remains Intact; Near-Term Deeper Retracement Potential
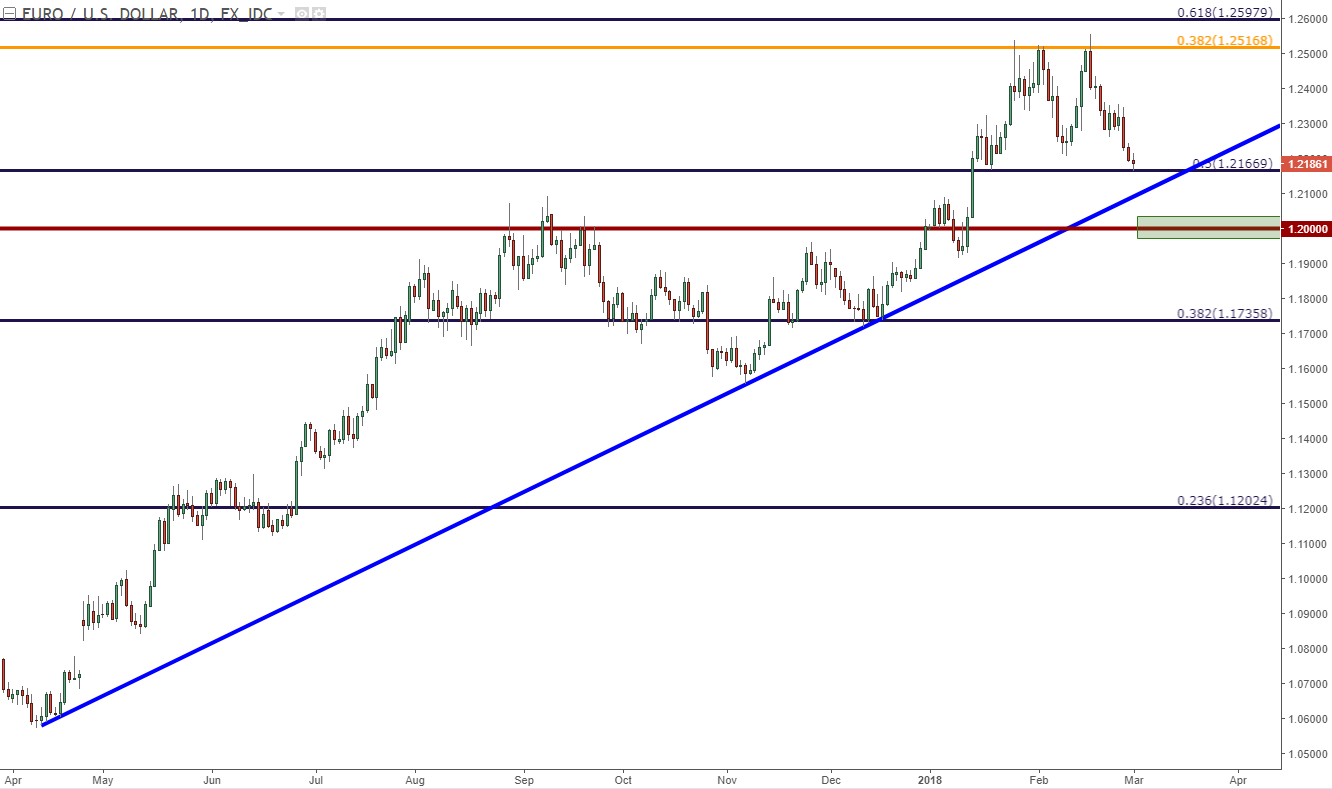
Chart prepared by James Stanley
On a shorter-term basis, there is a context for bearish continuation. Given the pair’s prior adherence to support and resistance, those same previous levels of support can now be utilized as resistsance. We’ve added on more level here, around 1.2250, and sellers showing at any of the levels inside of 1.2335 could be looked to for bearish continuation strategies.
EUR/USD Hourly: Short-Term Potential for Bearish Continuation
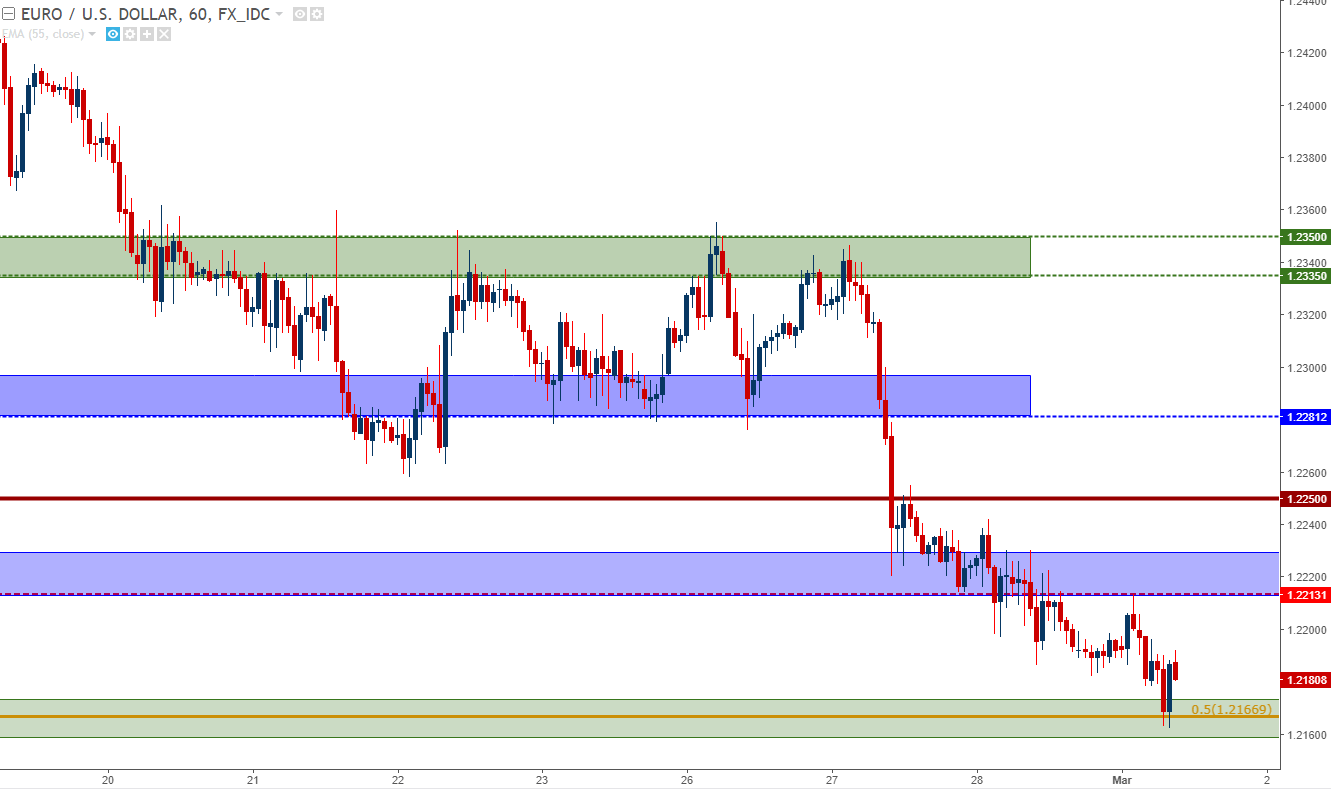
Chart prepared by James Stanley
To read more:
Are you looking for longer-term analysis on the Euro, the British Pound or the U.S. Dollar? Our DailyFX Forecasts for Q1 have a section for each major currency, and we also offer a plethora of resources on our EUR/USD, GBP/USD, USD/JPY, AUD/USD and U.S. Dollar pages. Traders can also stay up with near-term positioning via our IG Client Sentiment Indicator.
--- Written by James Stanley, Strategist for DailyFX.com
To receive James Stanley’s analysis directly via email, please SIGN UP HERE
Contact and follow James on Twitter: @JStanleyFX


