


- USD Strength is continuing and prices look poised to test the February high as we near the close of the month. Yesterday’s strength continued following the testimony from Mr. Jerome Powell, in which markets inferred the possibility of four rate hikes this year given strength in the US economy. This has also brought back some pressure into equities, and those prior trends of EUR/USD and GBP/USD strength are taking some hits as deeper support levels come into play.
- Mr. Powell takes the stage again tomorrow morning when he testifies in front of the Senate Banking Committee; and if we do see yesterday’s equity sell-off continue to break through support, fully expect ‘stocks in turmoil’ to be a headline theme tomorrow ahead of that testimony. This will likely elicit some questions from Congress to the regards of monetary policy and QE or perhaps even forecasts around rate hikes or forward guidance. All of which could make tomorrow’s testimony considerably more interesting than many of the questions that came from the House Financial Services Committee yesterday.
- Are you looking to improve your trading approach? Check out Traits of Successful Traders. And if you’re looking for an introductory primer to the Forex market, check out our New to FX Guide.
If you’re looking for longer-term analysis on US Stocks, the Euro or the U.S. Dollar, click here for our Trading Guides.
US Dollar Looks to Close February on a Bullish Note
The US Dollar continues to exhibit strength as we near the end of February. Here on the last day of the month, the Greenback has just touched-up to a fresh February high of 90.60, testing through the prior mark at 90.57; making for quite the interesting end to what’s been an eventful month. It was just two weeks ago that Dollar-weakness was permeating through most major pairs, continuing the trend that’s been in-place now for more than a year. But, as we turn the page into March, given some of the drivers that have helped to form this bullish move over the past couple of weeks, and there’s potential for continuation here. We discussed this in yesterday’s webinar at-length, with the primary premise derived from the fact that the Dollar has finally been able to hold-above the 90.00 level.
US Dollar Four-Hour Chart: Touches Up to Fresh February High on Last Day of the Month
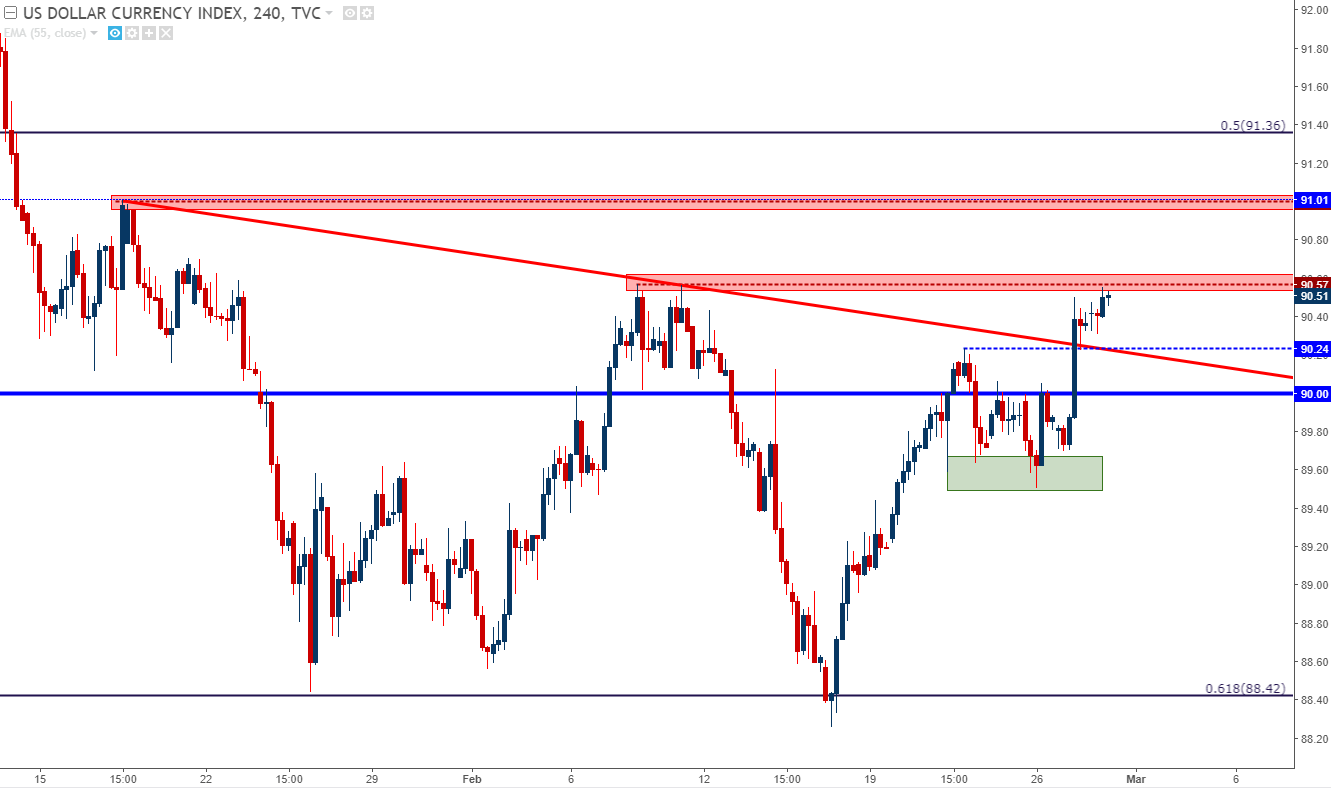
Chart prepared by James Stanley
EUR/USD Slips at Support, Buyers Trying to Hold the Line
USD Strength helped EUR/USD set a new February low yesterday, but once we touched below the prior swing of 1.2204, bears go bashful and prices pushed back above support. This makes for a rather unattractive setup in both directions: Bearish breakouts are complicated by the fact that we just had a false breakout yesterday. Bullish reversals are challenged by the fact that we just had a fresh low, and bulls haven’t exactly showed any tendency of reversing that move yet.
The more proactive way of going about manners may be to wait and see if bulls can hold support above yesterday’s swing-low, at which point a short-term bullish reversal setup can begin to get attractive. Alternatively, for those that want to sell, they can wait for some element of resistance to come into play off of prior support around 1.2281.
EUR/USD Four-Hour Chart: Bears Get Bashful At Fresh February Lows
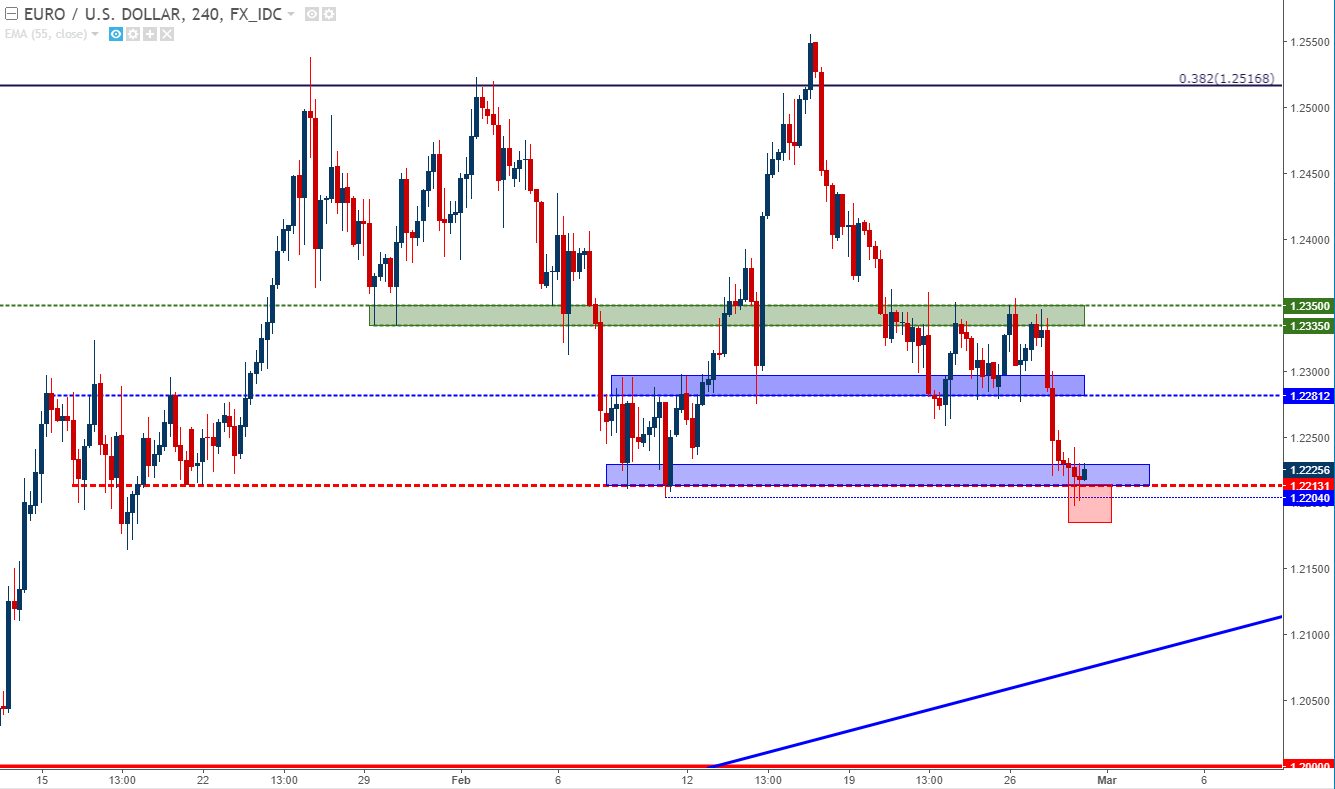
Chart prepared by James Stanley
Longer-term, the bullish trend in EUR/USD remains, but it wouldn’t appear attractive for resumption just yet, as a break of short-term support alludes to the potential for a deeper short-side move. Instead, those looking to work with that longer-term trend in EUR/USD can cast focus for support a bit deeper on the chart. 1.2167 has a Fibonacci level that had helped to set a swing-low in mid-January. Just a bit below that, projecting around ~1.2100, we have the bullish trend-line in the pair from last year. And below that, at 1.2000, we have a major psychological level that had previously given a strong dose of resistance but, to date, hasn’t yet seen much for support.
EUR/USD Daily Chart: Longer-Term Trend Remains
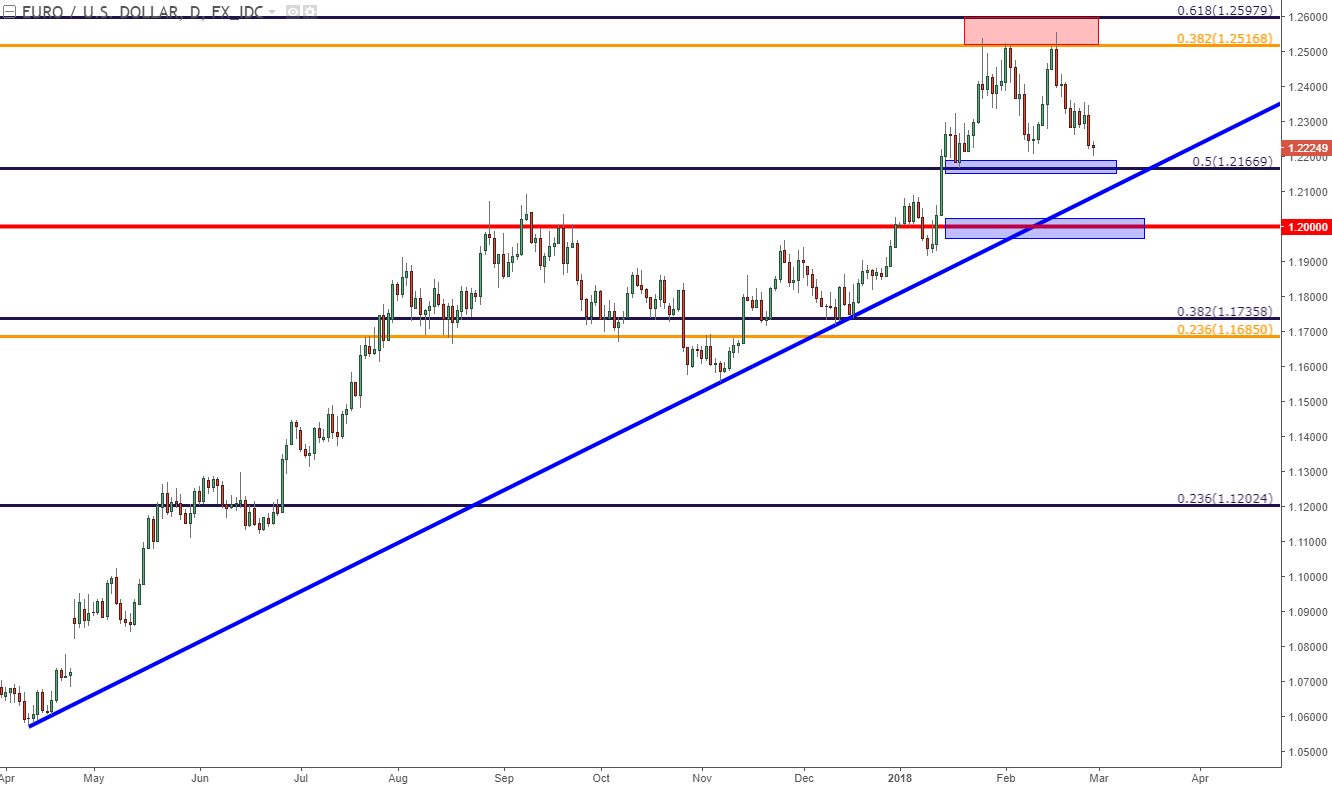
Chart prepared by James Stanley
GBP/USD Breaks Down – Look for Longer-Term Support
Somewhat similar to what we just looked at above, there’s a short-term bearish theme in a longer-term bullish trend. The difference here is that short-term price action in Cable has been utterly unattractive, and that longer-term area of potential support is a bit closer.
We’ve been watching a zone that runs from the February swing-low of 1.3765 up to the Fibonacci level at 1.3837; the goal of which is to find some element of higher-low support after the various support tests in this region over the past few weeks.
We are now trading in this zone. The big question is whether or not bulls show up and where exactly this might happen. Buying at the moment would be akin to trying to catch a falling knife, so waiting for support to set can be extremely important if looking to buy Cable anytime soon. We discuss how this can be done using price action in the article, Using Price Action to Trade Support and Resistance.
GBP/USD Daily Chart: Cable Testing Support Zone 1.3765-1.3837

Chart prepared by James Stanley
AUDUSD Resistance Potential
The pair that we’ve been following throughout the month for USD-strength scenarios has been AUD/USD. While USD strength was sketchy coming into February, a reversal had already gotten underway in in the pair after bulls failed after fresh two-year highs. That bearish theme has largely remained intact throughout the month, and after yesterday’s run of USD-strength, AUD/USD set a fresh two-week low. Prices have since started to bounce off of support around .7780, and there are a few areas of resistance potential that can open the door for down-side continuation.
The bullish short-term trend line we looked at yesterday could be the first of those potential resistance areas, and a bit-higher on the chart are zones around .7850 and .7900 that could be usable for such a scenario.
AUD/USD Hourly Chart: Short-Term Resistance Potential
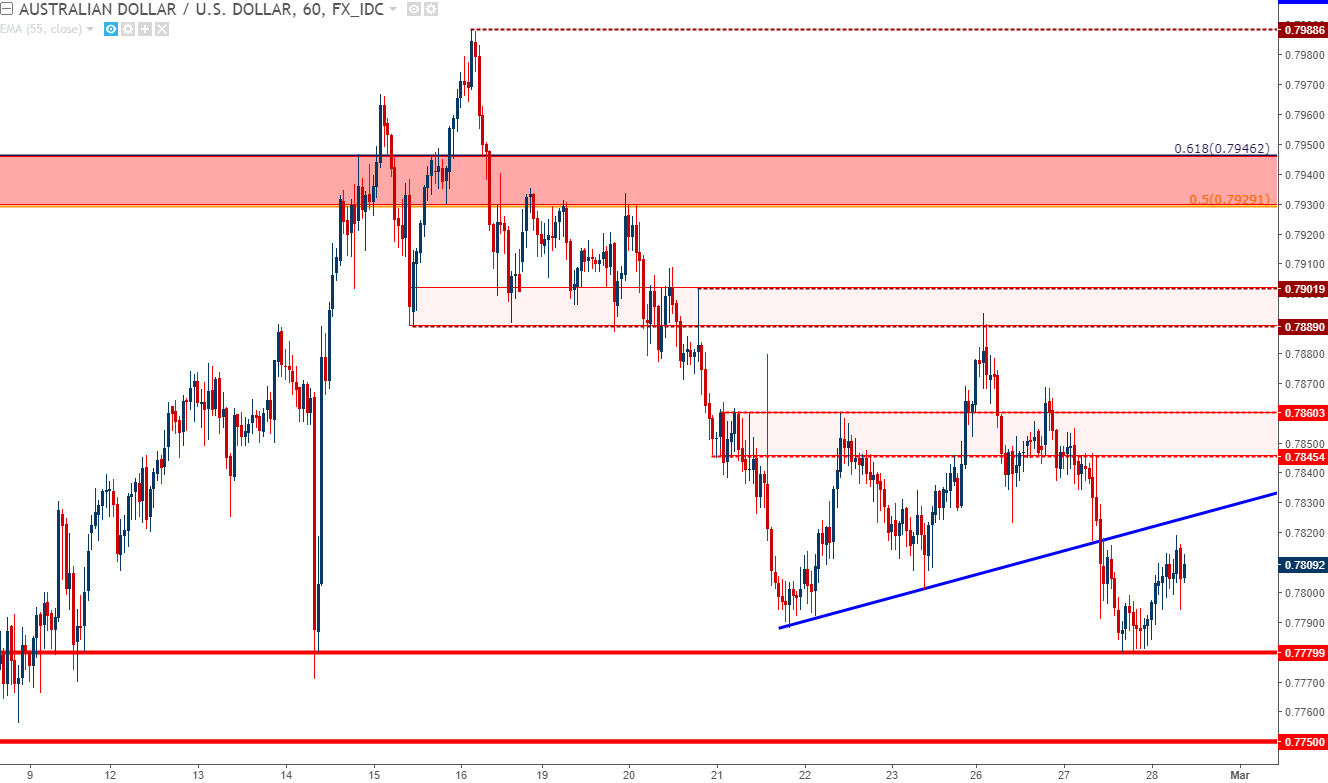
Chart prepared by James Stanley
US Stocks Take a Hit – Will Bulls Buy The Dip?
Also in yesterday’s article we looked at an area of potential support in the S&P 500. This was derived from the 61.8% retracement of the early-month sell-off; and this region had also given us a couple of iterations of prior resistance. Given the reaction across US equity markets yesterday, it would appear as though stocks did not like the insinuation from Mr. Powell that four rate hikes may be on the horizon for this year. Yesterday’s price action gave us a bearish engulfing candlestick in the S&P 500, and prices are clinging to that potential support zone around 2750 as we near this morning’s US equity open.
This would, in essence, offer two conflicting signals. Bearish engulfing are traded as continuation patterns, expecting the momentum that had engulfed the prior day’s price action to continue. On the other hand, this area of support continues a pattern of higher-highs and lows that can keep the door open for bullish stances.
Whenever a scenario of conflicting signals comes up, traders are faced with two choices: Either stay on the sidelines until the setup gets clearer; or, use various time frames to try to trade in between those themes.
The way that this can be done with the S&P 500 is to take a short-term bullish stance with the potential for a intermediate-term bearish stance. As in, longs can be investigated as long as this support holds. But – if short-term support breaks, we may be seeing continuation from yesterday’s bearish engulfing, and that can open the door for bearish momentum strategies down to deeper levels of support. Alternatively, traders can ignore the bearish stance altogether and instead look for a deeper area of support to take a stab at a bullish reversal again.
S&P 500 Hourly Chart: Prices Find Support in Zone, Deeper Support 2726, 2703

Chart prepared by James Stanley
To read more:
Are you looking for longer-term analysis on the Euro, the British Pound or the U.S. Dollar? Our DailyFX Forecasts for Q1 have a section for each major currency, and we also offer a plethora of resources on our EUR/USD, GBP/USD, USD/JPY, AUD/USD and U.S. Dollar pages. Traders can also stay up with near-term positioning via our IG Client Sentiment Indicator.
--- Written by James Stanley, Strategist for DailyFX.com
To receive James Stanley’s analysis directly via email, please SIGN UP HERE
Contact and follow James on Twitter: @JStanleyFX


