


Talking Points:
- Yesterday’s FOMC minutes brought an interesting response through markets, as USD-strength showed-up, coming-along with another bump-higher in Treasury yields after US stocks reversed an early-session gain to finish in the red. US equity futures found a bit of support around the Tokyo open, and have since been moving higher; and as the US comes online for the day, those Dollar gains from the FOMC Minutes have largely been erased.
- Tonight brings a very important inflation print out of Japan. So far 2018 has seen Yen-strength as a fairly consistent theme, and this appeared to hasten around the release of December inflation numbers last month. Those inflation numbers printed at 33-month highs, and this is likely creating some drive to close short-Yen bets under the fear that the BoJ may be looking at their own tapering-dilemma before too long. This scenario would be similar to the Euro and the ECB last year, as markets continued to try to get in-front of a stimulus exit even when the Central Bank is saying that it’s not yet in the cards.
- Are you looking to improve your trading approach? Check out Traits of Successful Traders. And if you’re looking for an introductory primer to the Forex market, check out our New to FX Guide.
If you’re looking for longer-term analysis on US Stocks, the Euro or the U.S. Dollar, click here for our Trading Guides.
FOMC Minutes Bring Volatility
Yesterday’s FOMC minutes were not without fanfare as a bit of volatility showed up on the back of the release. US Equities were probably the most noteworthy, reversing early-session gains to finish the session in the red. This happened alongside another jump in yields, with yields on the 10-Year US Treasury Note up to a fresh-four year high of 2.94%. This puts us just 10 basis points away from the seven-year high of 3.04%, and this begs the question as to whether higher yields may start to more-gravely impact the equity space.
10-Year Treasury Yield, Monthly Chart: Fresh Four-Year Highs

The silver lining of yesterday’s sell-off in US stocks is that it does give traders some levels to work with. Prices found a bit of resistance around 2750 in the S&P, which is a similar area that had helped to carve-out last week’s resistance. Prices sold-off as we led into the Tokyo open, trickling all the way down to 2684, at which point a bit of support began to develop around a prior swing-high.
S&P 500 Hourly Chart: Resistance ~2750, Support 2685
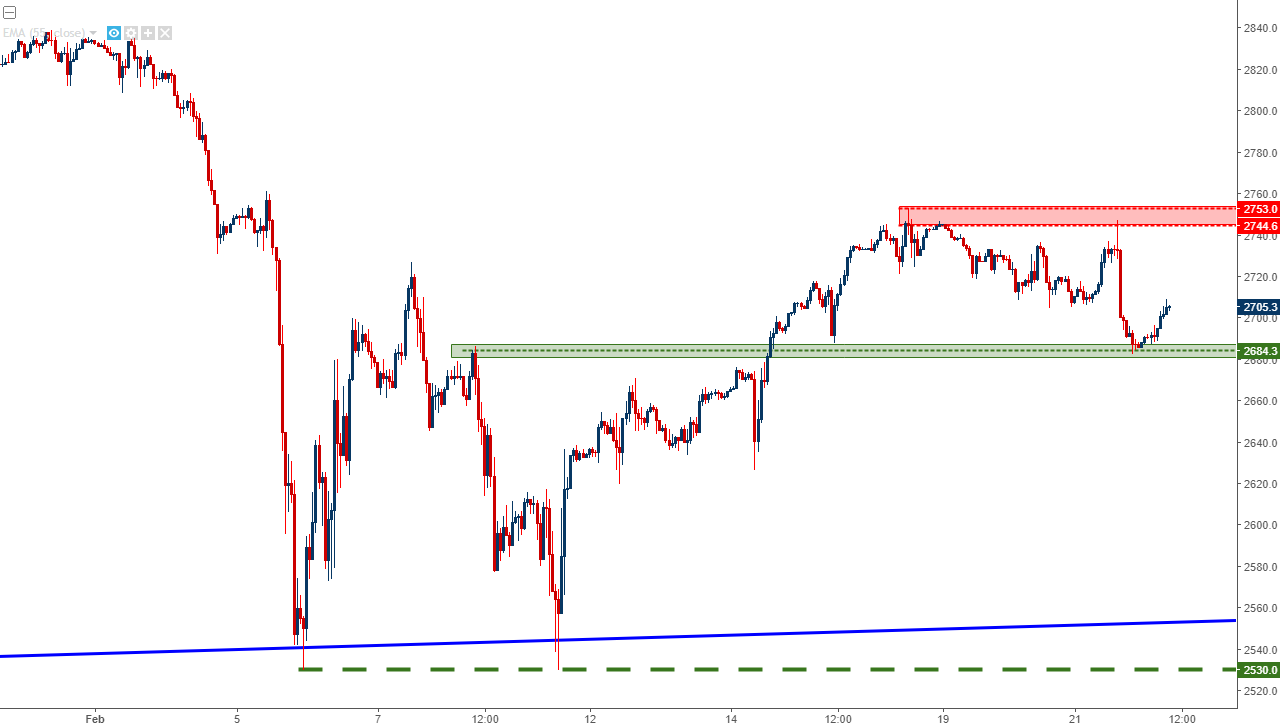
Chart prepared by James Stanley
DXY Climbs Above 90, and Then Gives it Up
Also moving along with yesterday’s FOMC minutes was the US Dollar. DXY re-eclipsed the 90.00 level; and this is the same price that had helped to reverse matters last week around US inflation figures. Dollar strength continued to show into the close of the US session, and continued into the European open at which point a small pullback began to show. Prices moved back to find a bit of support on that 90.00 level, but it could not hold and sellers do not yet look done. The big question is whether we see some support develop today that may allow for this short-term bullish trend to continue. Below, we’re looking at a couple of levels to follow for such an observation.
US Dollar via ‘DXY’ Hourly Chart: Potential Supports Applied
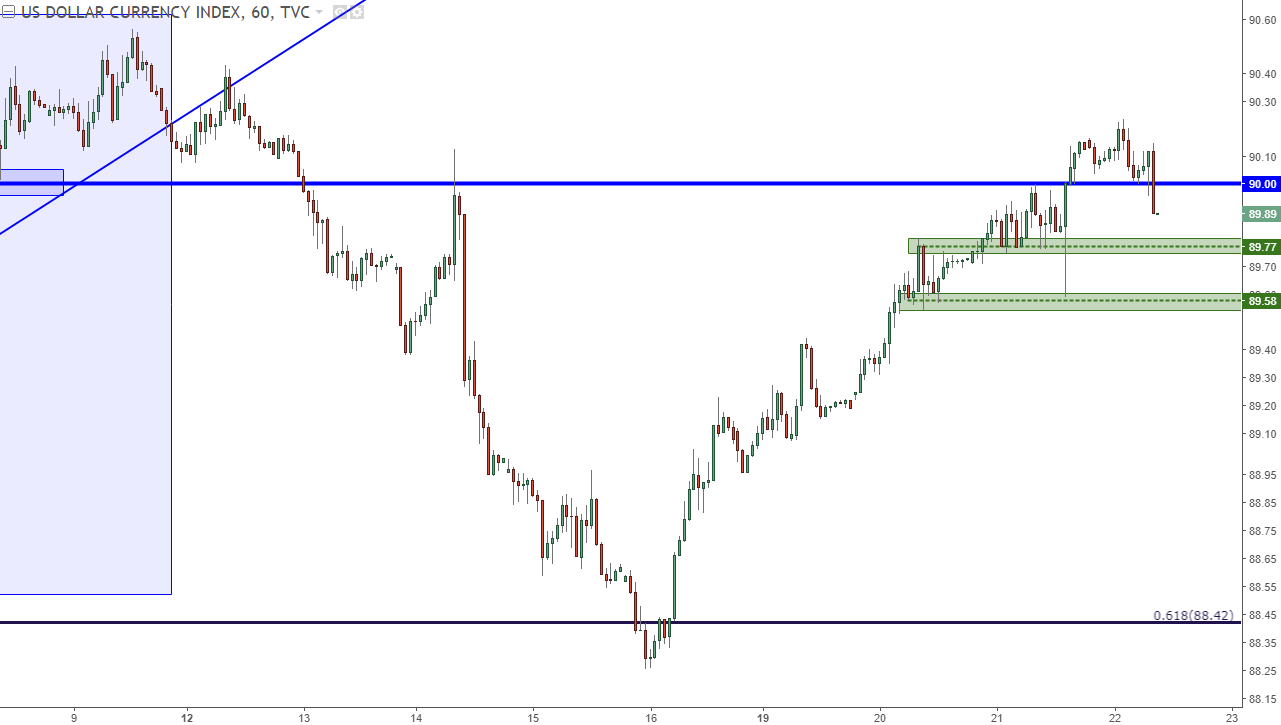
Chart prepared by James Stanley
USD Strategy
We’ve been following various pairs in the effort of optimizing positioning around the US Dollar. For USD-strength strategies, we’ve been following AUD/USD; and for USD-weakness we’ve been looking at USD/CHF. Yesterday’s USD rip has played out in both pairs, and this sets each up in an interesting manner as we head towards the end of this week.
In USD/CHF, prices have moved up to a key zone of resistance, and for those looking for USD-weakness, this could be an attractive way of looking to integrate that theme. We published an Analyst Pick on the pair yesterday, and the updated chart setup is below.
USD/CHF Four-Hour Chart: Rally to Resistance Zone, Sellers Begin to Show
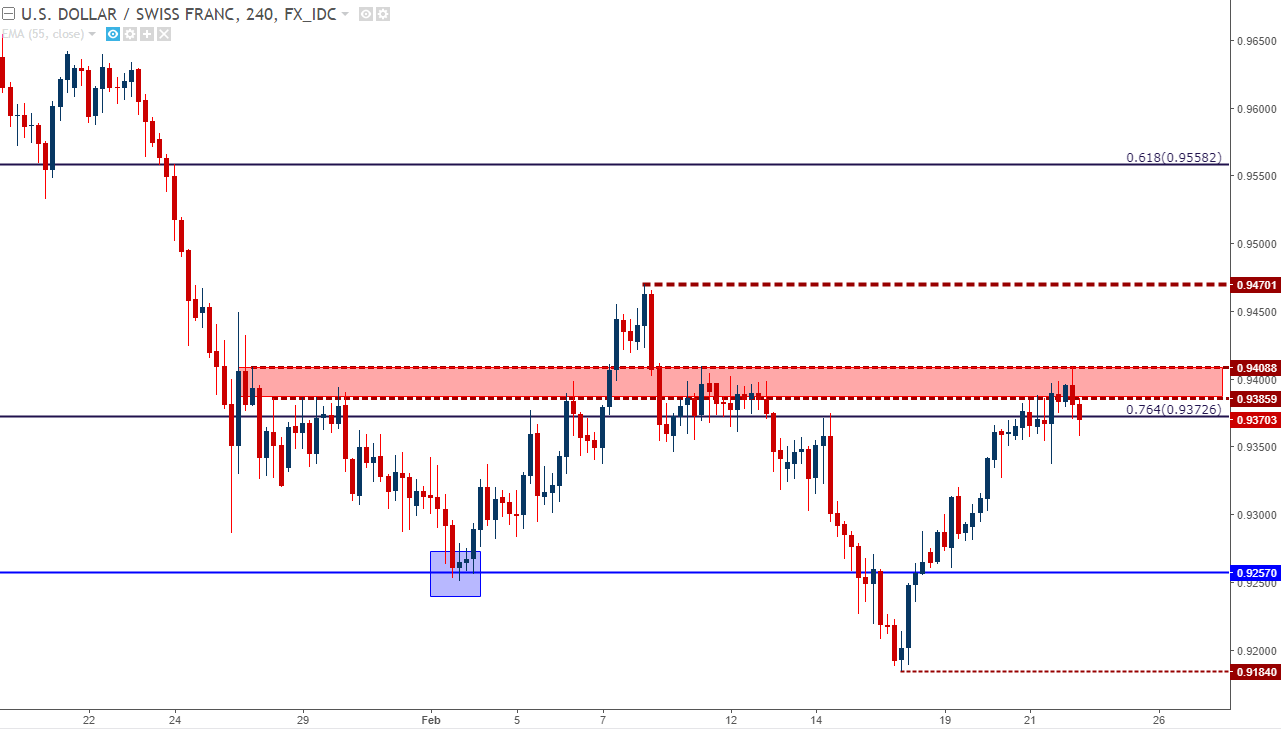
Chart prepared by James Stanley
For USD-Strength Strategies, Look to AUD/USD
On the other side of the Dollar, we’ve been following AUD/USD. While the US Dollar has remained relatively weak since the last week of January, AUD/USD began to show a bearish reversal into a trend that appears to have some continuation potential. Yesterday’s Dollar-strength drove the pair down towards support; but with a bit of a pullback showing over the last few hours, traders can start to look for continuation scenarios. This would be an attractive setup for those looking at a continuation of USD-strength, and we published an Analyst Pick on this pair last week when USD was in the process of carving-out a bottom (and AUD/USD carving out a near-term high).
AUD/USD Hourly Chart: Lower-High Resistance Potential

Chart prepared by James Stanley
Japanese Inflation Numbers Tonight – Watch the Yen
The big items remaining on the calendar are Japanese inflation numbers tonight and Canadian inflation numbers tomorrow morning. The Japanese Inflation numbers set to be released tonight appear to be especially important, as we’ve seen a recent theme of Yen-strength develop that begs a number of interesting questions. It’s perhaps not coincidental that this tonality change in the Yen began to show around the same time that Japanese inflation numbers perked up. In January, we got December data that showed inflation at its highest level in 33 months.
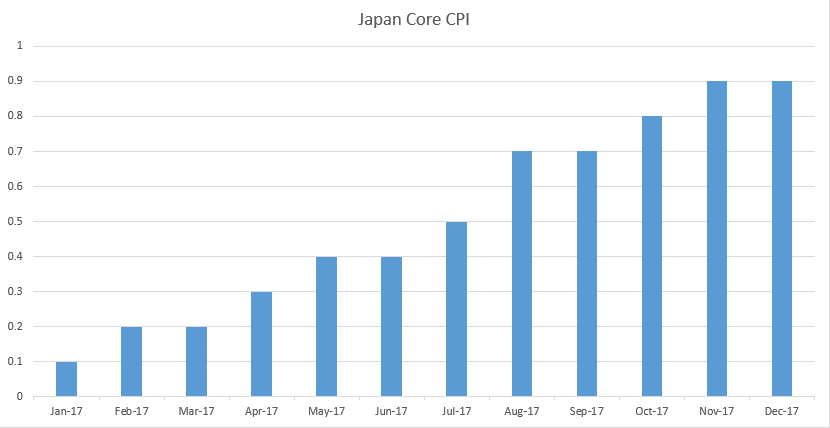
Japanese CPI at 33-Month High in December

prepared by James Stanley
This strength in inflation also goes along with what’s been a steady stream of strength in core CPI, which (in Japan) strips out fresh food items from the data.
prepared by James Stanley
How Does Strength in Inflation Impact the Yen?
This would be similar to what was seen in the Euro last year, when the ECB continued to say that they weren’t anywhere near ready for a QE-exit or even a taper; and yet markets continued to bid the single currency-higher through much of last year.
Markets are forward-looking; and market participants spend their days trying to read the tea leaves. They won’t often hang around and wait for the guillotine to drop; and this is somewhat of what we’re seeing in US Treasury bonds at the moment. Stronger forces of inflation coupled with a hawkish Fed make the prospect of holding long bonds downright daunting; as it appears very likely that the US government will be net sellers of bonds this year after years of playing the role as a net buyer. More supply equals lower prices, and lower prices bring higher yields. So – what we’re seeing take place right now is not happening out of nowhere.
The same can perhaps be said about the Japanese Yen. As those signs of inflation have continued to perk-up, markets are gearing up for a potential tapering of stimulus; even though the BoJ hasn’t said anything on the matter. As a matter of fact, the BoJ has very recently re-committed to stimulus, and the architect of the massive stimulus program, BoJ Governor Haruhiko Kuroda, has just been re-appointed for a second five-year term.
So – it would probably be a bit presumptuous at this point to say that the inflation that we’ve seen thus far will push the BoJ away from their uber-dovish policy. But – until we hear that from the BoJ, fully expect markets to be looking for clues and hints that this may happen.
The next big clue comes out tonight: This is when we get Japanese inflation numbers for the month of January, and if this comes out at greater than one-percent, look for Yen-strength to continue. If we do get a sub-one print on the headline number, it is possible for Yen-weakness to begin showing back-up; but we’d likely need to hear something more definitive from the BoJ on the matter before this is a workable theme.
USD/JPY Trending-Lower Throughout 2018
USD/JPY has spent pretty much all of 2018 trending-lower, and putting in a rather large move from the highs above 113.00 to the lows around 105.50. Much of this price action has shown-up in a bearish channel, as we’re looking at on the hourly chart below:
USD/JPY Hourly Chart: 2018 in a Bearish Channel
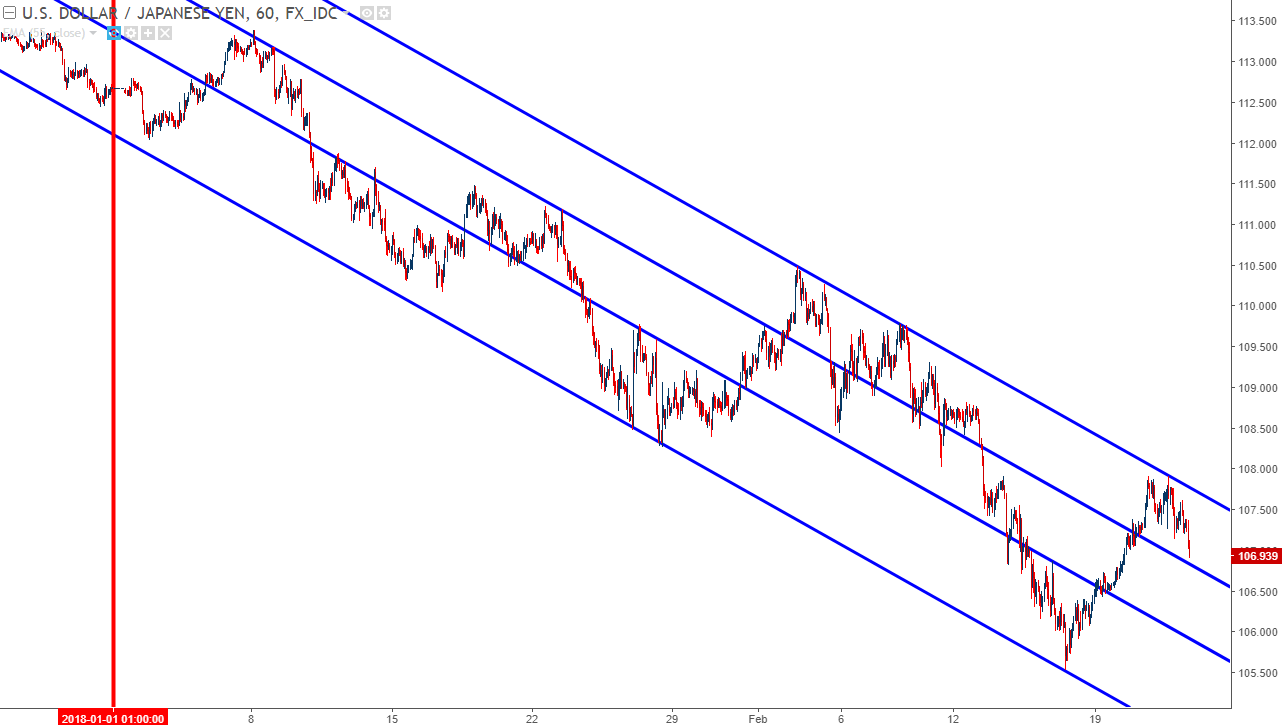
Chart prepared by James Stanley
That sell-off ran into a really interesting level last week, and since then a bit of recovery has begun to show. The support in question comes-in off of a prior trend-line projection that makes up a symmetrical wedge formation. These wedges can be great for trading breakouts if/when either side of the wedge breaks. And while we came close last week, bulls have thus far been able to temper the sell-off to push prices back-up to near-term resistance.
USD/JPY Weekly: Support Test of Symmetrical Wedge Brings Bounce From Last Week’s Lows
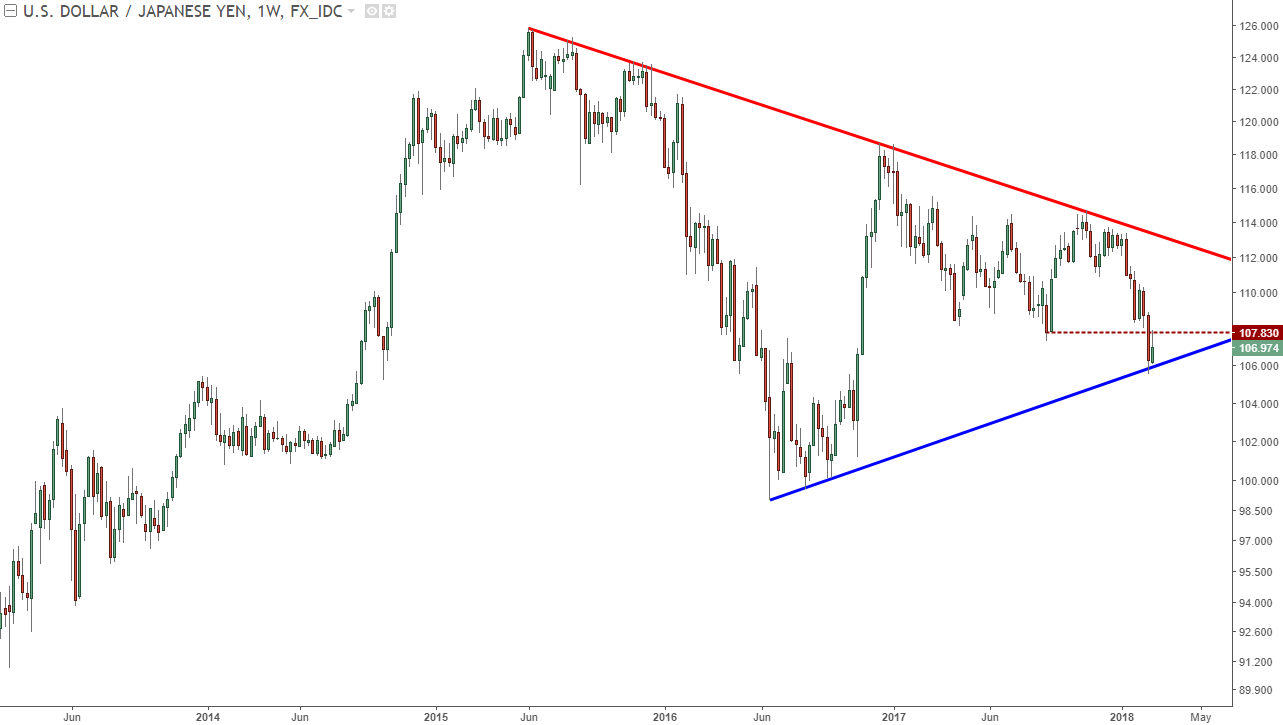
Chart prepared by James Stanley
If Japanese inflation comes out above one-percent on Thursday, look for Yen-strength to continue. Pressing that strength against the US Dollar may present challenges given that the Greenback is going through its own themes at the moment. But, directing that Yen-strength towards other pairs such as EUR/JPY or even GBP/JPY could be an opportunistic way of looking to integrate that theme.
To read more:
Are you looking for longer-term analysis on the Euro, the British Pound or the U.S. Dollar? Our DailyFX Forecasts for Q1 have a section for each major currency, and we also offer a plethora of resources on our EUR/USD, GBP/USD, USD/JPY, AUD/USD and U.S. Dollar pages. Traders can also stay up with near-term positioning via our IG Client Sentiment Indicator.
--- Written by James Stanley, Strategist for DailyFX.com
To receive James Stanley’s analysis directly via email, please SIGN UP HERE
Contact and follow James on Twitter: @JStanleyFX


